

Answered step by step
Verified Expert Solution
Question
1 Approved Answer
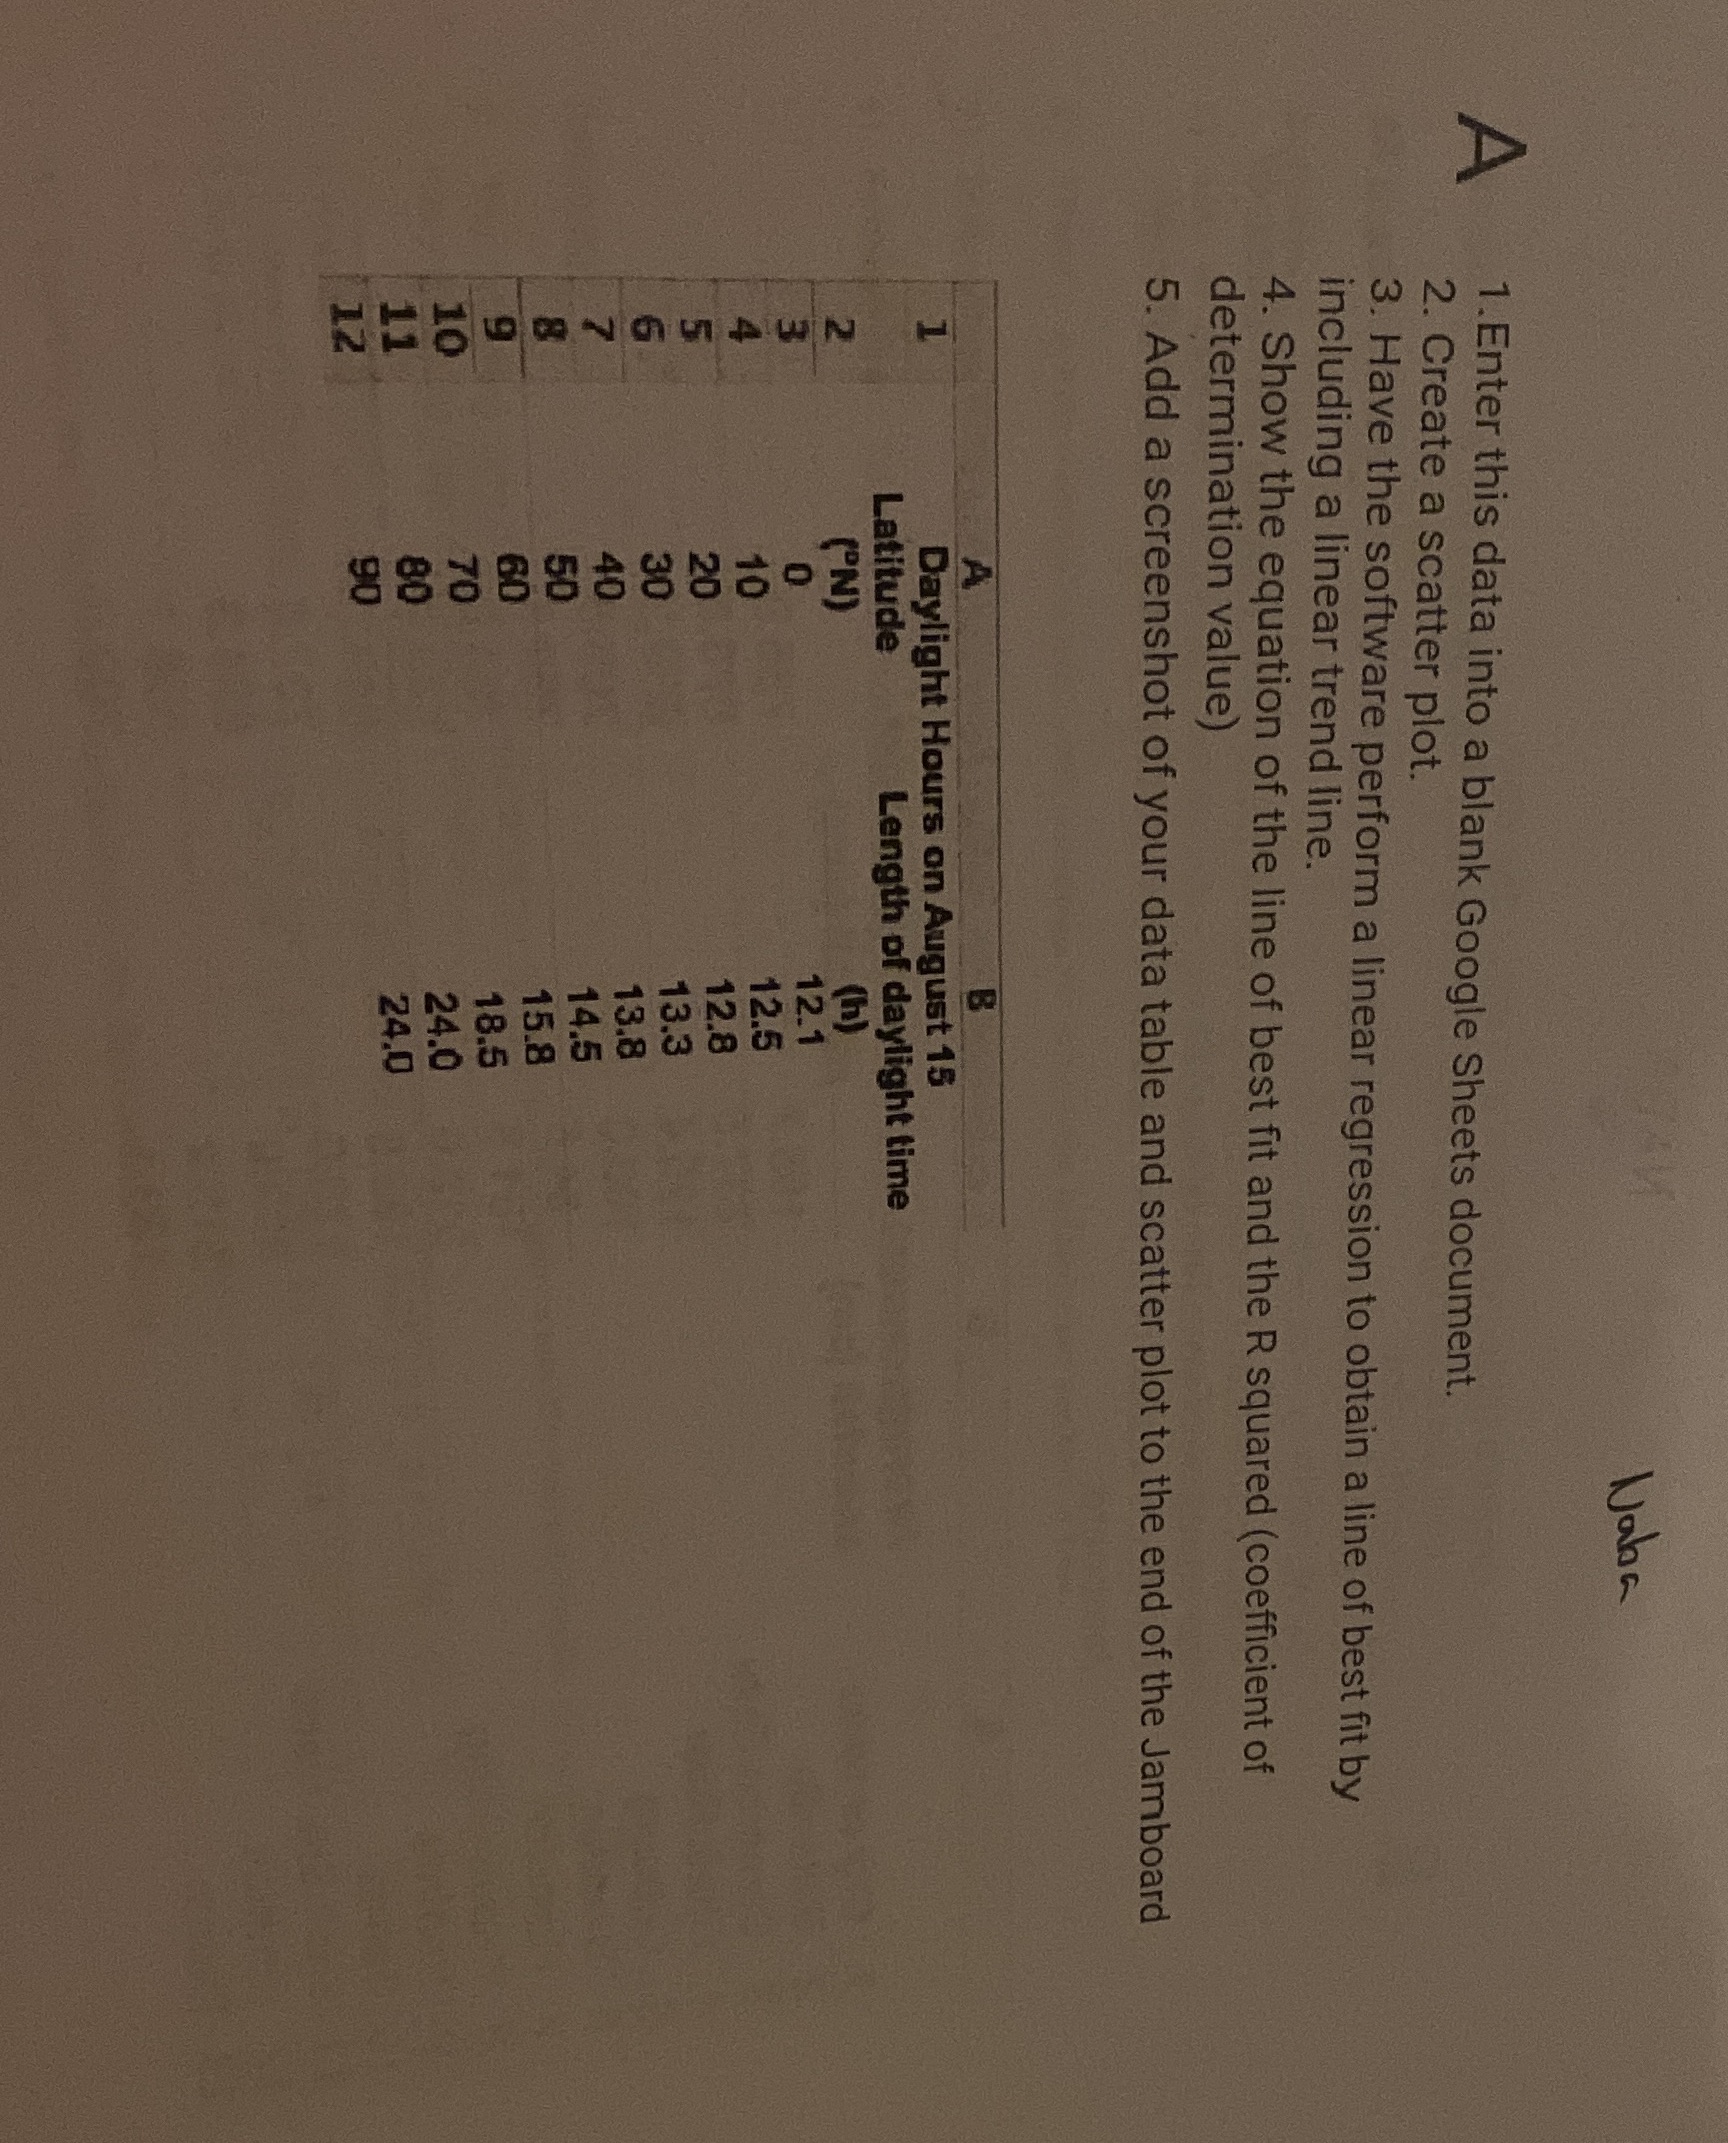
Naba 1. Enter this data into a blank Google Sheets document. 2. Create a scatter plot. 3. Have the software perform a linear regression to
Step by Step Solution
There are 3 Steps involved in it
Step: 1

Get Instant Access to Expert-Tailored Solutions
See step-by-step solutions with expert insights and AI powered tools for academic success
Step: 2

Step: 3
Ace Your Homework with AI
Get the answers you need in no time with our AI-driven, step-by-step assistance
Get Started
Climate Mathematics Theory And Applications
Authors: Samuel S P Shen, Richard C J Somerville
1st Edition
1108750184, 9781108750189