

Answered step by step
Verified Expert Solution
Question
1 Approved Answer
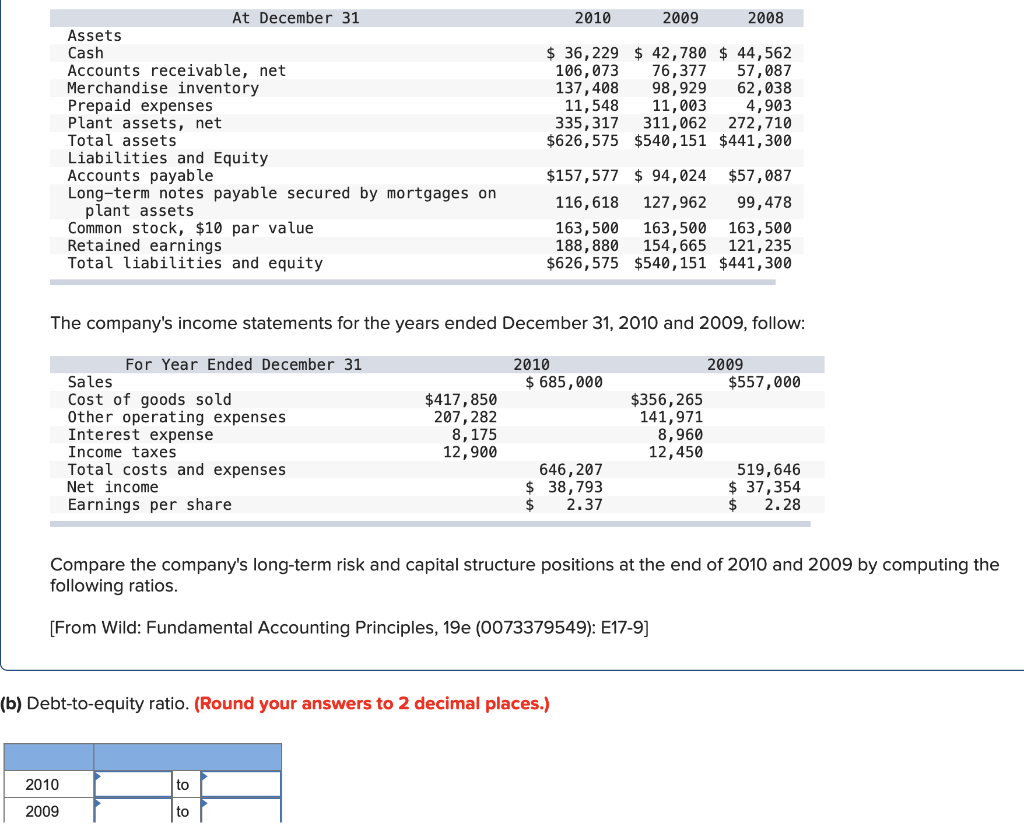
Nabisco Company's balance sheet accounts follow: 2010 2009 2008 At December 31 Assets Cash Accounts receivable, net Merchandise inventory Prepaid expenses Plant assets, net Total
Nabisco Company's balance sheet accounts follow:
Step by Step Solution
There are 3 Steps involved in it
Step: 1

Get Instant Access to Expert-Tailored Solutions
See step-by-step solutions with expert insights and AI powered tools for academic success
Step: 2

Step: 3
Ace Your Homework with AI
Get the answers you need in no time with our AI-driven, step-by-step assistance
Get Started
Financial Times Guide To Finance For Non Financial Managers
Authors: Jo Haigh
1st Edition
0273756206, 978-0273756200