Answered step by step
Verified Expert Solution
Link Copied!

Question

1 Approved Answer

Name_ Algebra Scatter Plots and Residual Plots 1) A teacher was trying to determine how a student's homework grade affected their test grade. She used
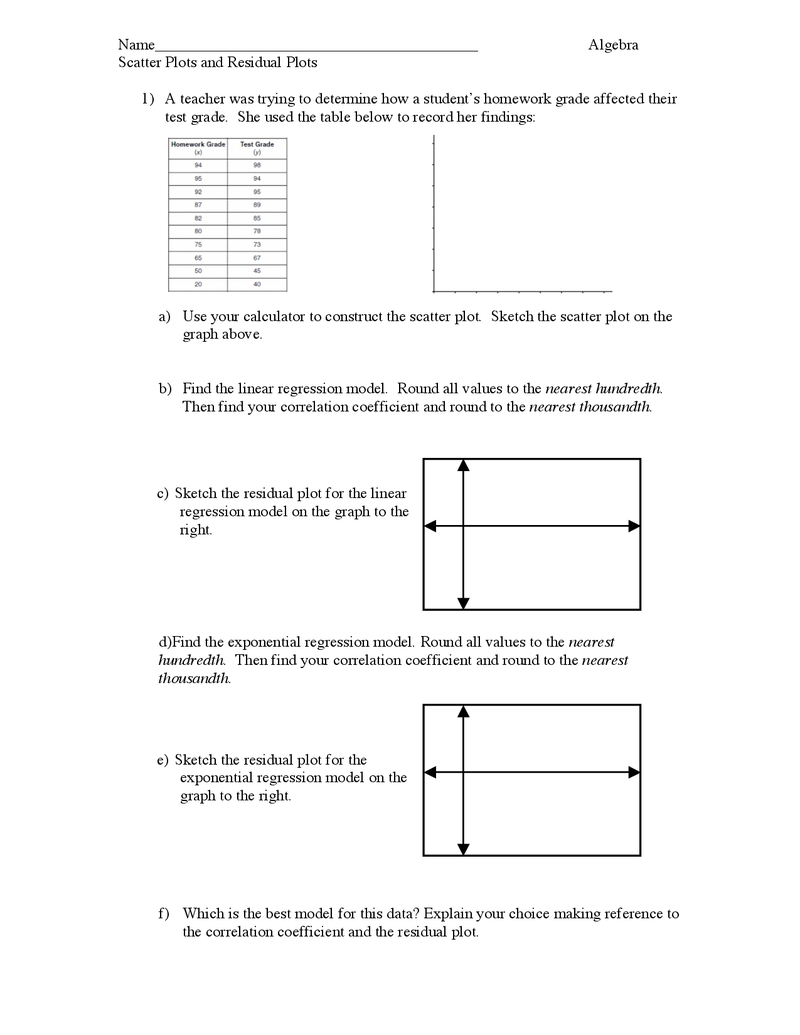
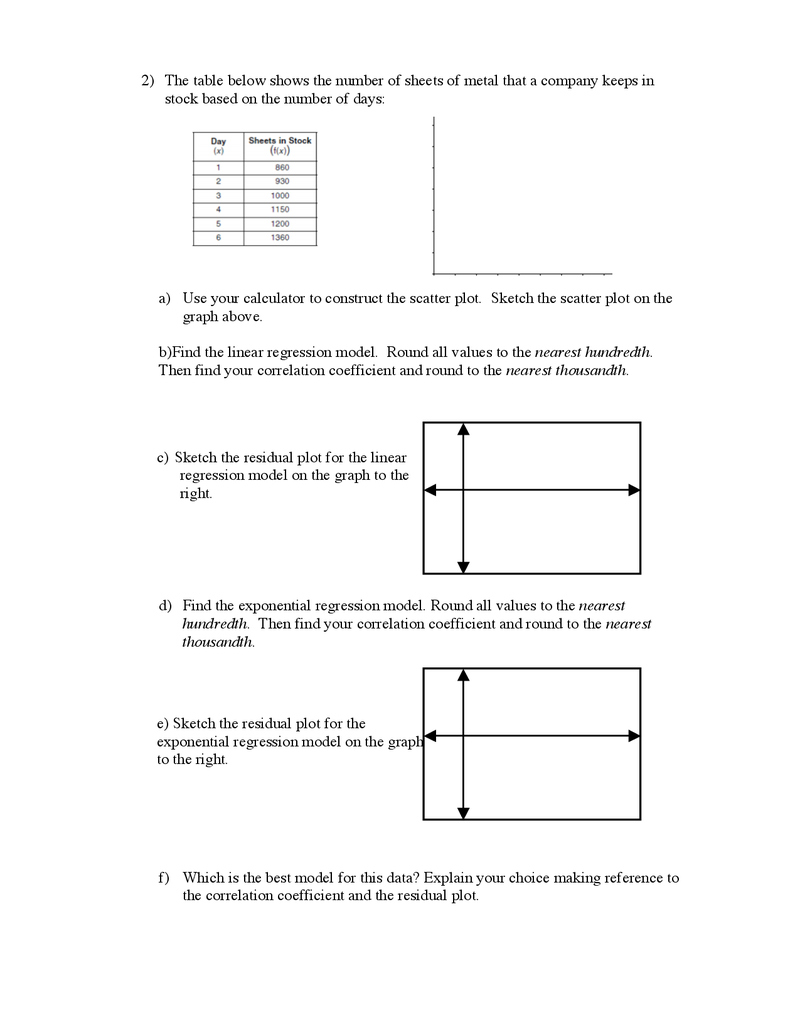
image text in transcribedimage text in transcribed
Name_ Algebra Scatter Plots and Residual Plots 1) A teacher was trying to determine how a student's homework grade affected their test grade. She used the table below to record her findings: mework Grade Test Grade 94 87 75 65 8 8 8 a) Use your calculator to construct the scatter plot. Sketch the scatter plot on the graph above. b) Find the linear regression model. Round all values to the nearest hundredth. Then find your correlation coefficient and round to the nearest thousandth. c) Sketch the residual plot for the linear regression model on the graph to the right. d)Find the exponential regression model. Round all values to the nearest hundredth. Then find your correlation coefficient and round to the nearest thousandth. e) Sketch the residual plot for the exponential regression model on the graph to the right. f) Which is the best model for this data? Explain your choice making reference to the correlation coefficient and the residual plot.2) The table below shows the number of sheets of metal that a company keeps in stock based on the number of days: Day Sheets in Stock (x) 860 1000 1150 1200 1360 a) Use your calculator to construct the scatter plot. Sketch the scatter plot on the graph above. b)Find the linear regression model. Round all values to the nearest hundredth. Then find your correlation coefficient and round to the nearest thousandth. c) Sketch the residual plot for the linear regression model on the graph to the right. d) Find the exponential regression model. Round all values to the nearest hundredth. Then find your correlation coefficient and round to the nearest thousandth. e) Sketch the residual plot for the exponential regression model on the graph to the right. f) Which is the best model for this data? Explain your choice making reference to the correlation coefficient and the residual plot

Step by Step Solution

There are 3 Steps involved in it

Step: 1

blur-text-image

Get Instant Access to Expert-Tailored Solutions

See step-by-step solutions with expert insights and AI powered tools for academic success

Step: 2

blur-text-image

Step: 3

blur-text-image

Ace Your Homework with AI

Get the answers you need in no time with our AI-driven, step-by-step assistance

Get Started

Recommended Textbook for

Making Hard Decisions with decision tools

Authors: Robert Clemen, Terence Reilly

3rd edition

538797576, 978-0538797573

More Books

Students also viewed these Mathematics questions