

Answered step by step
Verified Expert Solution
Question
1 Approved Answer
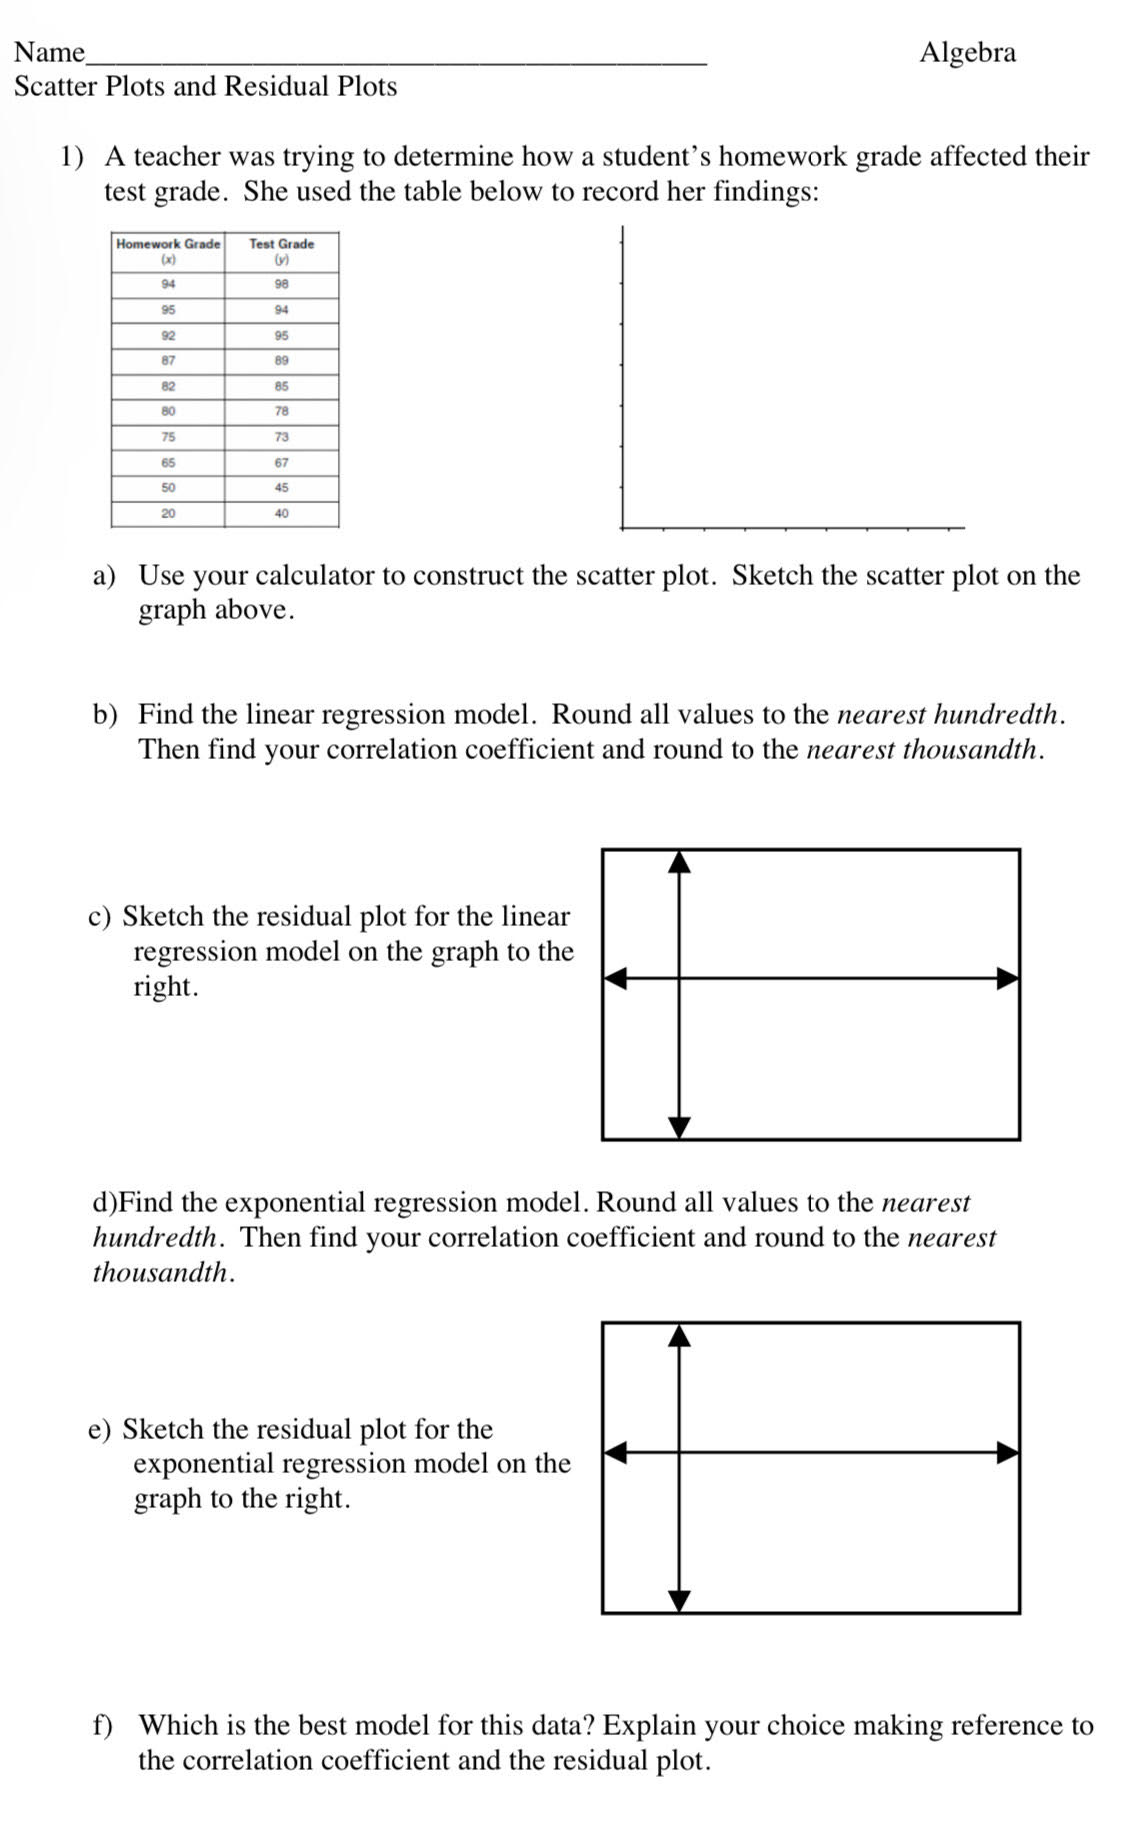
Name Algebra Scatter Plots and Residual Plots 1) A teacher was trying to determine how a student's homework grade affected their test grade. She used
Step by Step Solution
There are 3 Steps involved in it
Step: 1

Get Instant Access to Expert-Tailored Solutions
See step-by-step solutions with expert insights and AI powered tools for academic success
Step: 2

Step: 3
Ace Your Homework with AI
Get the answers you need in no time with our AI-driven, step-by-step assistance
Get Started
Trigonometry
Authors: Ron Larson, Rosemarie Menager Beeley, Larson/Hostetler
8th Edition
1111789177, 9781111789176