

Answered step by step
Verified Expert Solution
Question
1 Approved Answer
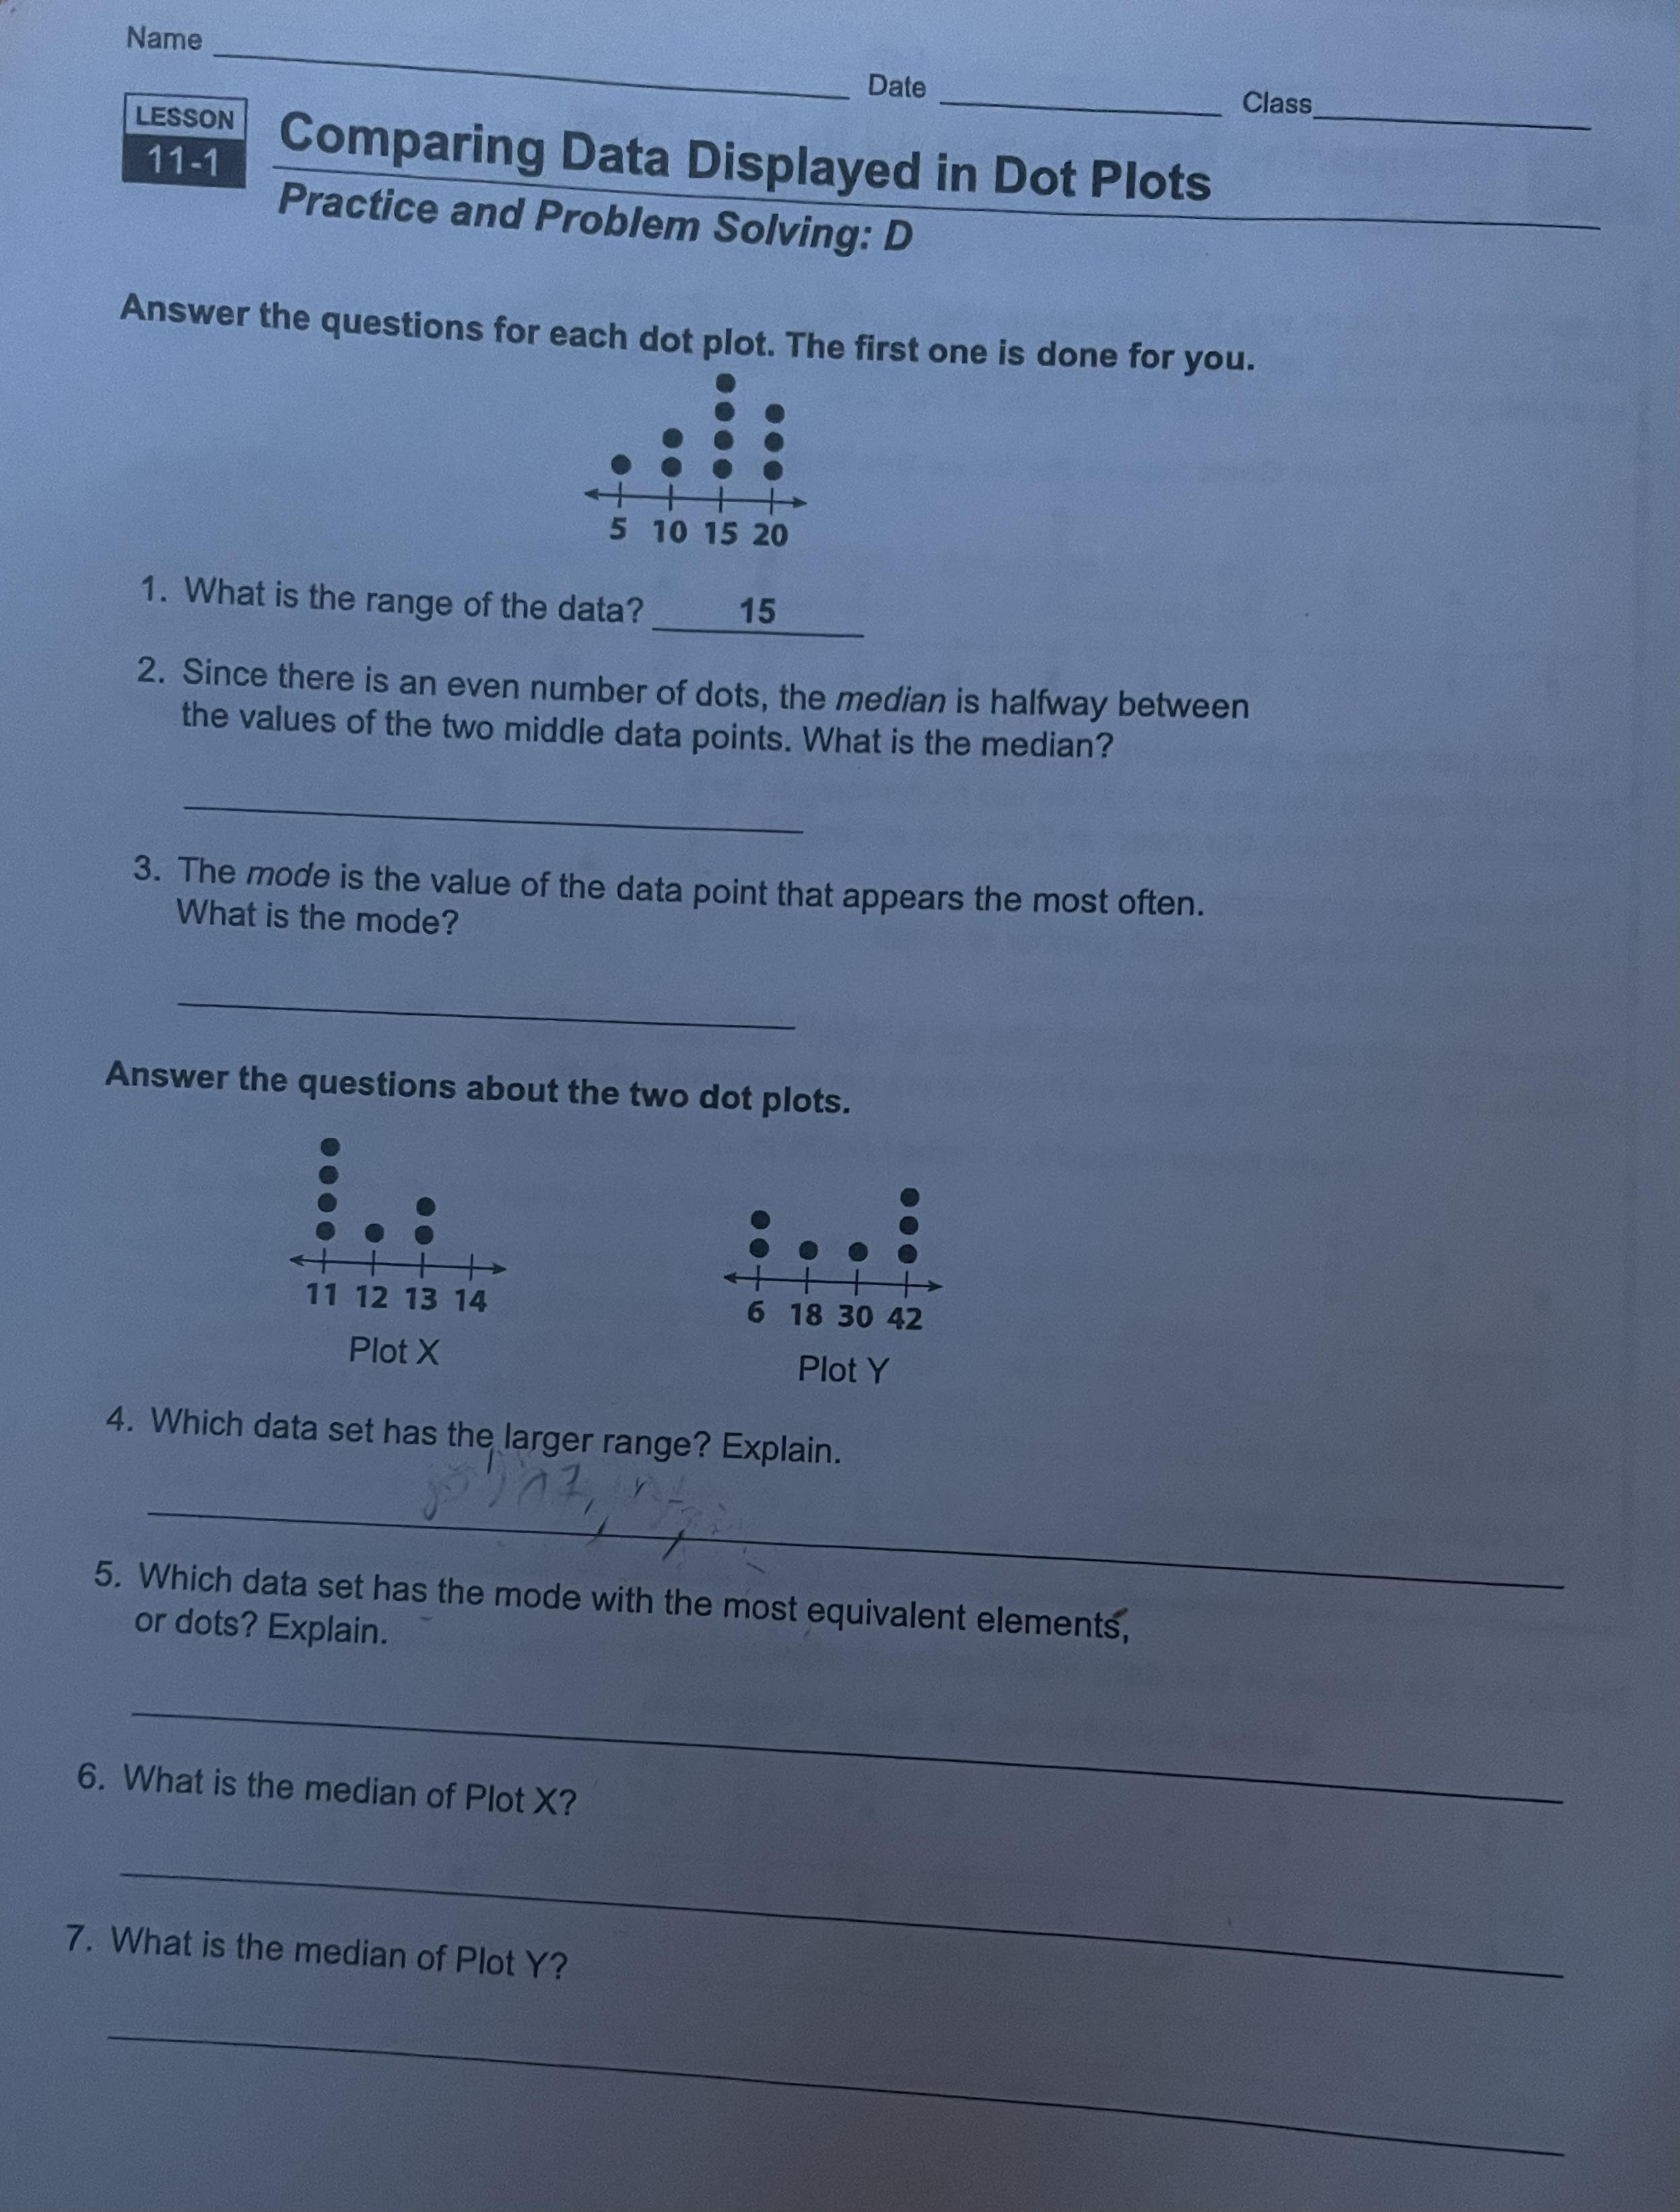
Name Date Class LESSON 11-1 Comparing Data Displayed in Dot Plots Practice and Problem Solving: D Answer the questions for each dot plot. The first
Step by Step Solution
There are 3 Steps involved in it
Step: 1

Get Instant Access to Expert-Tailored Solutions
See step-by-step solutions with expert insights and AI powered tools for academic success
Step: 2

Step: 3
Ace Your Homework with AI
Get the answers you need in no time with our AI-driven, step-by-step assistance
Get Started
College Algebra Concepts Through Functions
Authors: Michael Sullivan, Michael Sullivan III
3rd Edition
0321925890, 9780321925893