

Question: NAME DATE Pre-Lah ti Below is a chart which has data for an investigation where a large fan cart with various mass loads was run.
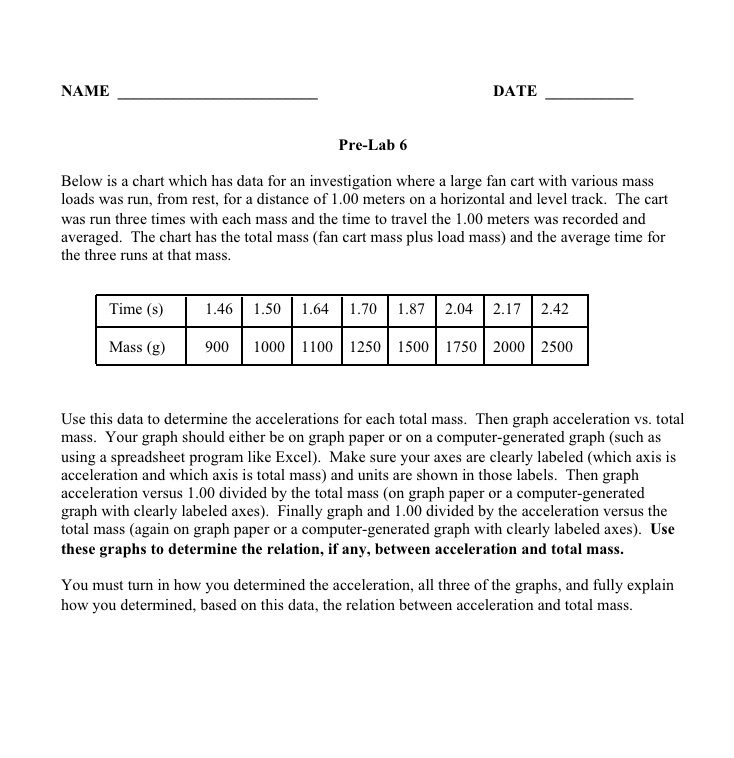
NAME DATE Pre-Lah ti Below is a chart which has data for an investigation where a large fan cart with various mass loads was run. from rest. for a distance of 1.131] meters on a horizontal and level track. The cart was run three times with each mass and the time to travel the 1.00 meters was recorded and averaged. The chart has the total mass {fan cart mass plus load mass] and the average time for the three runs at that mass. Timets} 1.45 1.50 1.54 La) mmm. Use this data to determine the accelerations for each total mass. Then graph acceleration vs. total mass. Your graph should either be on graph paper or on a computergenerated graph {such as using a spreadsheet program like Excel}. Make sure your axes are clearly labeled (which axis is acceleration and which axis is total mass} and units are shown in those labels. Then graph acceleration versus 1.00 divided by the total mass (on graph paper or a computer-generated graph with clearly labeled axes}. Finally graph and LUD divided by the acceleration versus the total mass [again on graph paper or a computergenerated graph with clearly labeled axes]. Use these graphs to determine the relation. if any. between acceleration and total mass. You must tum in howr you determined the acceleration. all three ofthe graphs. and fully explain how you deten'nined. based on this data. the relation between acceleration and total mass
Step by Step Solution
There are 3 Steps involved in it

Get step-by-step solutions from verified subject matter experts