Answered step by step
Verified Expert Solution
Link Copied!

Question

1 Approved Answer

Name Map4C Test. Graphical models. Trends. 1. The graph shows the temperature on Sarah's deck over time: 23 Temperature ( C) 19 $ 12:00 2:00
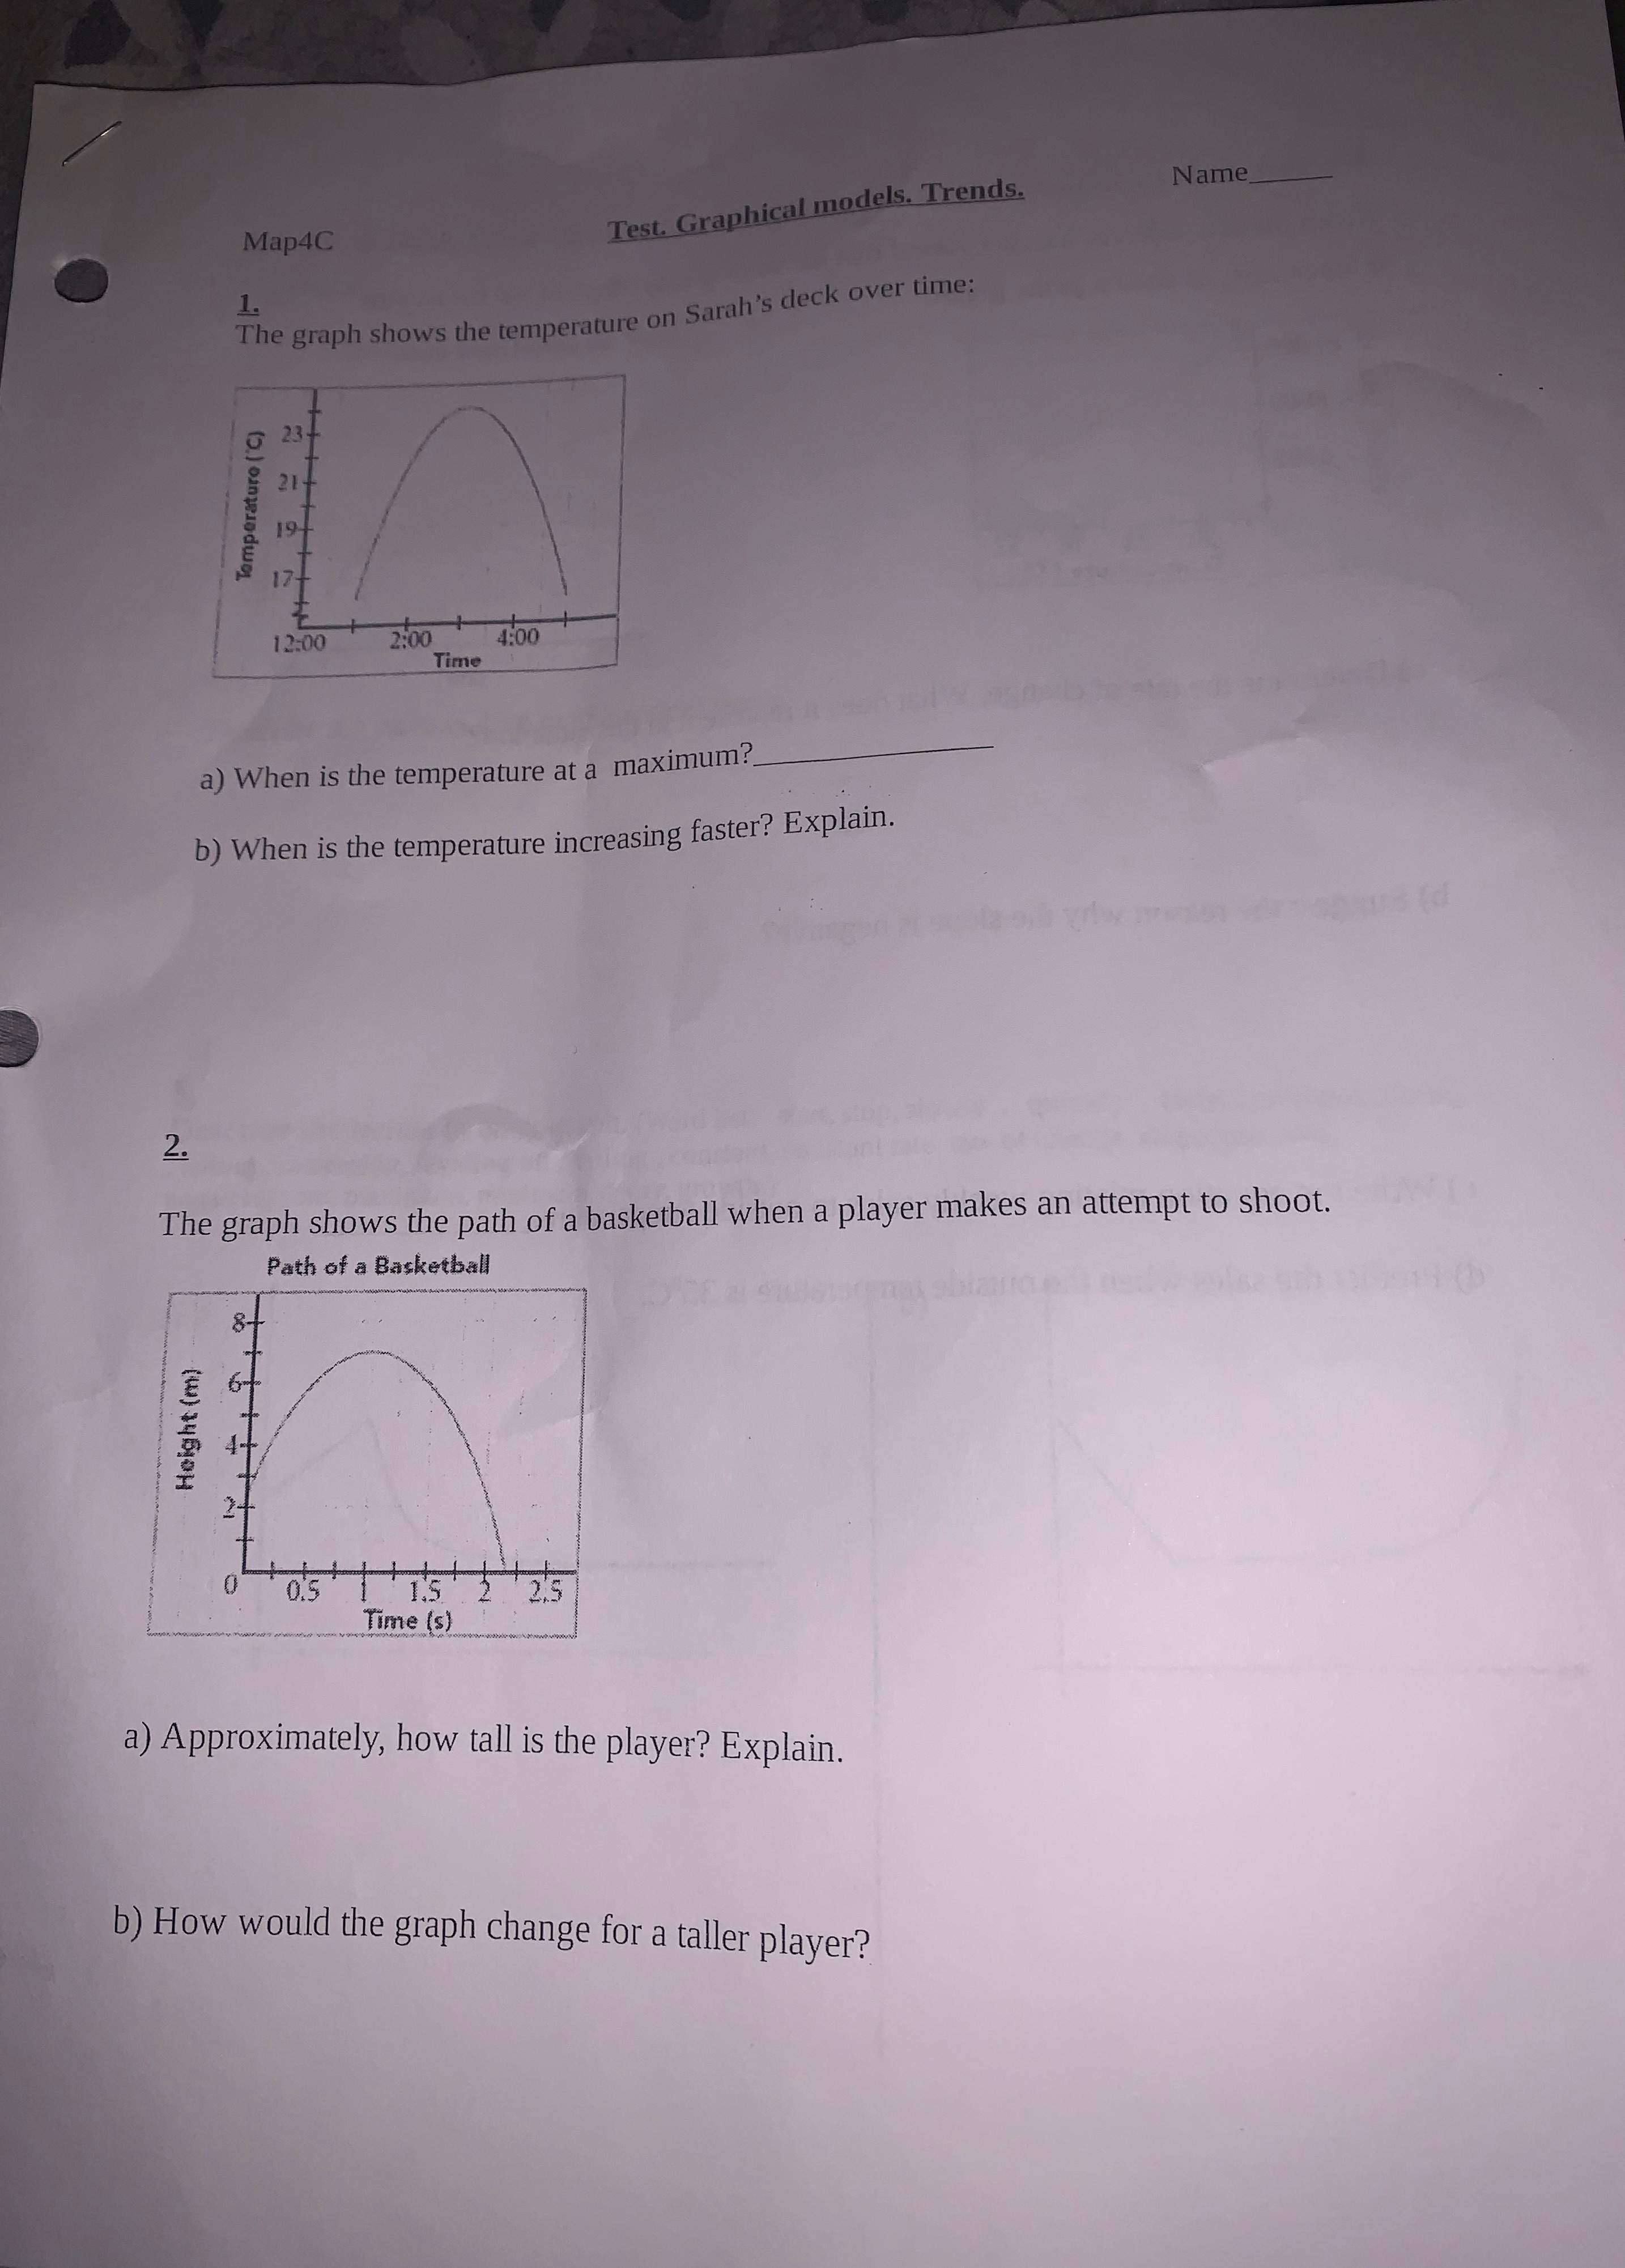
image text in transcribed
Name Map4C Test. Graphical models. Trends. 1. The graph shows the temperature on Sarah's deck over time: 23 Temperature ( C) 19 $ 12:00 2:00 4:00 Time a) When is the temperature at a maximum?_ b) When is the temperature increasing faster? Explain. 2. The graph shows the path of a basketball when a player makes an attempt to shoot. Path of a Basketball biance. Height (m) 0'S 25 Time (s) a) Approximately, how tall is the player? Explain. b) How would the graph change for a taller player

Step by Step Solution

There are 3 Steps involved in it

Step: 1

blur-text-image

Get Instant Access to Expert-Tailored Solutions

See step-by-step solutions with expert insights and AI powered tools for academic success

Step: 2

blur-text-image_2

Step: 3

blur-text-image_3

Ace Your Homework with AI

Get the answers you need in no time with our AI-driven, step-by-step assistance

Get Started

Recommended Textbook for

Finite Mathematics and Its Applications

Authors: Larry J. Goldstein, David I. Schneider, Martha J. Siegel, Steven Hair

12th edition

978-0134768588, 9780134437767, 134768582, 134437764, 978-0134768632

More Books

Students also viewed these Mathematics questions