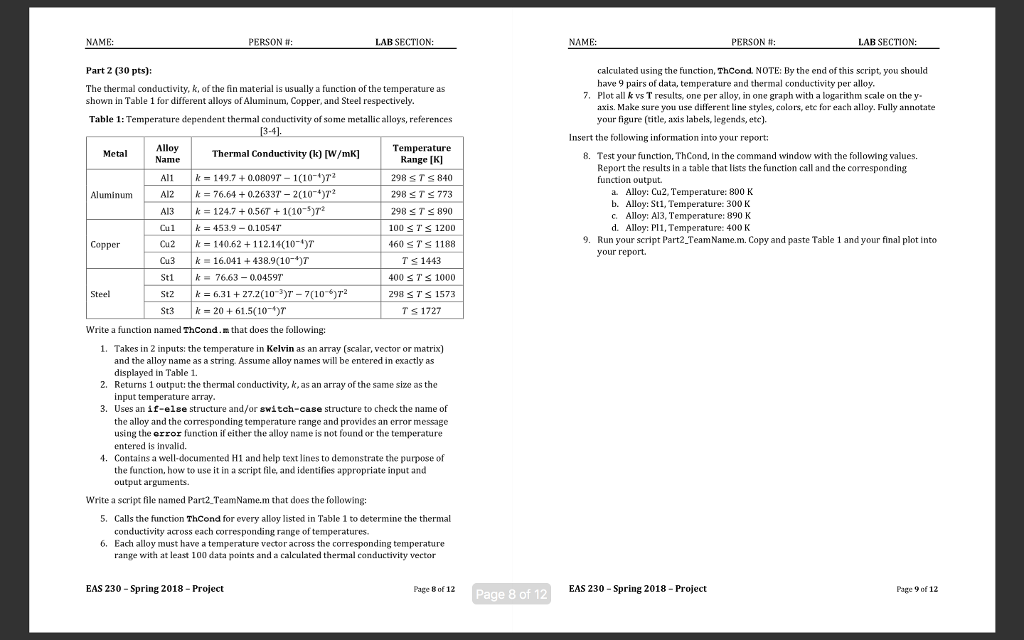
NAME PERSON #: LAB SECTION NAME: PERSON #: LAB SECTION: calculated using the function, ThCond. NOTE: By the end of this script, you should have 9 pairs of data, temperature and thermal conductivity per alloy. Plot all k vs T results, one per alloy, in one graph with a logarithm scale on the y- axis. Make sure you use different line styles, colors, ete for each allay. Fully annotate your figure (title, axis lahels, legends, ete). Part 2 (30 pts): The thermal conductivity, k, of the fin material is usually a function of the temperature as shown in Table 1 for different alloys of Aluminum, Copper, and Steel respectively. 7. Table 1: Temperature dependent thermal conduivity of some metallic alloys, references -4 Insert the following information into your report: Alloy Name Temperature Metal Thermal Conductivity (k) [W/mK] B. Test your function, ThCond, In the command window with the following values. Report the results in a table that lists the function call and the corresponding function output. All k 149.7 0.0809T 1(10)2 Al2 76.640.26337 2(10-2 Al3 124.7 0.56T 1(10-s)2 Cul 453.9-0.10547 Cu2 140.62112.14(10-4) Cu3 16.041 438.9 (10-4)T St1 7663-004597 St2 k6.31 27.2(10-3) 7(10 6)T2 St3 k 2061.5(10-)T Range [K] 298 STS 840 298 T773 29BT 890 100 T 1200 460STS 1188 T s 1443 400 STS 1000 298 T 1573 T S 1727 a. Alloy: Cu2, Temperature: 800 K b. Alloy: St1, Temperature: 300 K c. Alloy: A13, Temperature: 890 K d. Alloy: Pl1, Temperature: 400 K Aluminum 9. Run your script Part2 TeamName.m. Copy and paste Table 1 and your final plot into Copper your report. Steel Write a function named ThCond.m that does the following: 1. Takes in 2 inputs: the temperature in Kelvin as an array (scalar, vector or matrix) and the alloy name as a string. Assume alloy names will be entered in exactly as displayed in Table 1. Returns 1 output: the thermal conductivity, k, as an array of the same size as the input temperature array Uses an if-else structure and/or switch-case structure to check the name of the alloy and the corresponding temperature range and provides an error message using the error function if either the alloy name is not found or the temperature entered is invalid. Contains a well-documented H1 and help text lines to demonstrate the purpose of the function, how to use it in a script file, and identifies appropriate nput and output arguments 2. 3. 4. Write a script file named Part2 TeamName.m that does the following: 5. Calls the function ThCond for every alloy listed in Table 1 to determine the thermal conductivity across each corresponding range of temperatures Each alloy must have a temperature vector across the corresponding temperature range with at least 100 data points and a calculated thermal conductivity vector 6. EAS 230 -Spring 2018-Project Page 8 of 12 EAS 230-Spring 2018-Project Page 9 of 12 Page 8 of 12 NAME PERSON #: LAB SECTION NAME: PERSON #: LAB SECTION: calculated using the function, ThCond. NOTE: By the end of this script, you should have 9 pairs of data, temperature and thermal conductivity per alloy. Plot all k vs T results, one per alloy, in one graph with a logarithm scale on the y- axis. Make sure you use different line styles, colors, ete for each allay. Fully annotate your figure (title, axis lahels, legends, ete). Part 2 (30 pts): The thermal conductivity, k, of the fin material is usually a function of the temperature as shown in Table 1 for different alloys of Aluminum, Copper, and Steel respectively. 7. Table 1: Temperature dependent thermal conduivity of some metallic alloys, references -4 Insert the following information into your report: Alloy Name Temperature Metal Thermal Conductivity (k) [W/mK] B. Test your function, ThCond, In the command window with the following values. Report the results in a table that lists the function call and the corresponding function output. All k 149.7 0.0809T 1(10)2 Al2 76.640.26337 2(10-2 Al3 124.7 0.56T 1(10-s)2 Cul 453.9-0.10547 Cu2 140.62112.14(10-4) Cu3 16.041 438.9 (10-4)T St1 7663-004597 St2 k6.31 27.2(10-3) 7(10 6)T2 St3 k 2061.5(10-)T Range [K] 298 STS 840 298 T773 29BT 890 100 T 1200 460STS 1188 T s 1443 400 STS 1000 298 T 1573 T S 1727 a. Alloy: Cu2, Temperature: 800 K b. Alloy: St1, Temperature: 300 K c. Alloy: A13, Temperature: 890 K d. Alloy: Pl1, Temperature: 400 K Aluminum 9. Run your script Part2 TeamName.m. Copy and paste Table 1 and your final plot into Copper your report. Steel Write a function named ThCond.m that does the following: 1. Takes in 2 inputs: the temperature in Kelvin as an array (scalar, vector or matrix) and the alloy name as a string. Assume alloy names will be entered in exactly as displayed in Table 1. Returns 1 output: the thermal conductivity, k, as an array of the same size as the input temperature array Uses an if-else structure and/or switch-case structure to check the name of the alloy and the corresponding temperature range and provides an error message using the error function if either the alloy name is not found or the temperature entered is invalid. Contains a well-documented H1 and help text lines to demonstrate the purpose of the function, how to use it in a script file, and identifies appropriate nput and output arguments 2. 3. 4. Write a script file named Part2 TeamName.m that does the following: 5. Calls the function ThCond for every alloy listed in Table 1 to determine the thermal conductivity across each corresponding range of temperatures Each alloy must have a temperature vector across the corresponding temperature range with at least 100 data points and a calculated thermal conductivity vector 6. EAS 230 -Spring 2018-Project Page 8 of 12 EAS 230-Spring 2018-Project Page 9 of 12 Page 8 of 12


