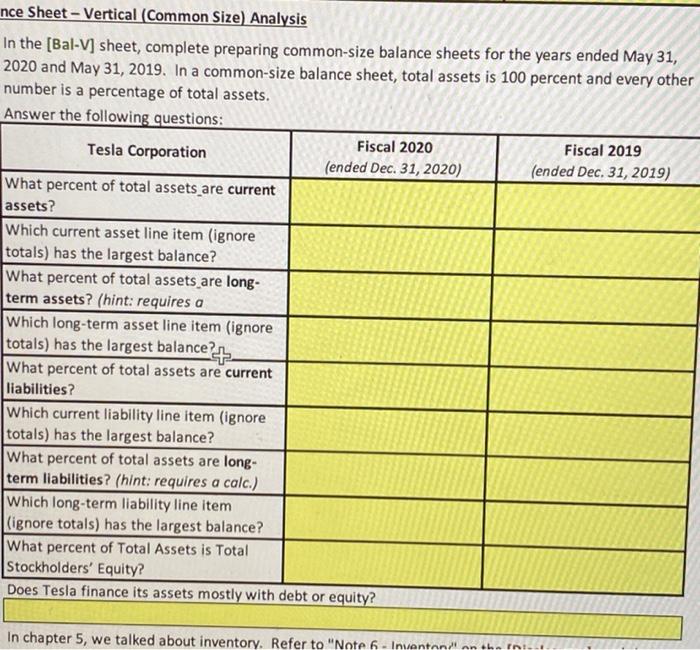
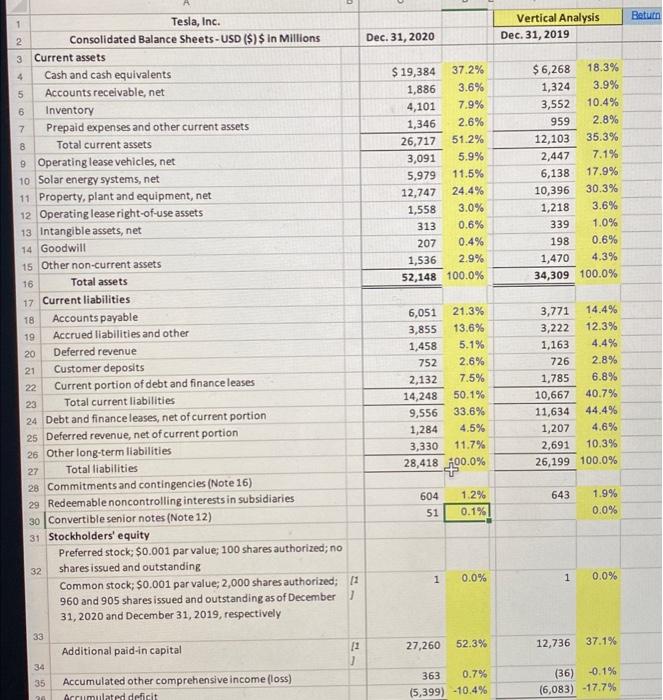
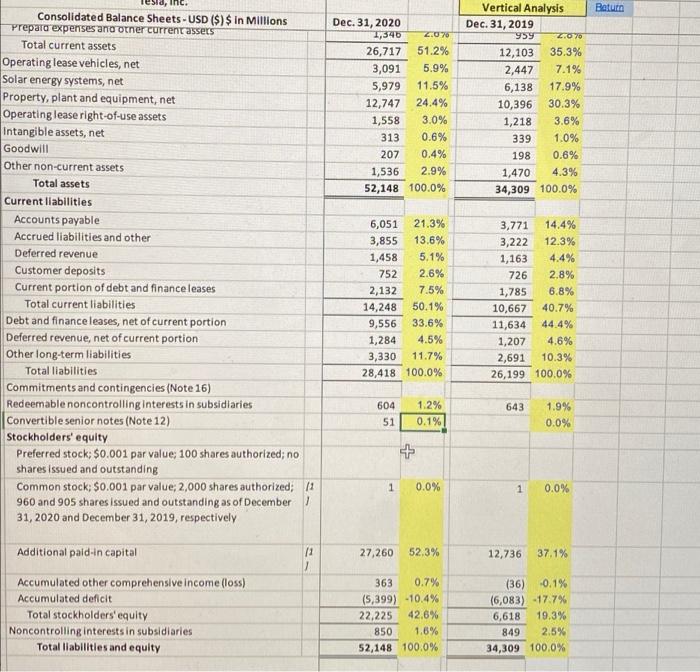
nce Sheet - Vertical (Common Size) Analysis In the [Bal-V] sheet, complete preparing common-size balance sheets for the years ended May 31, 2020 and May 31, 2019. In a common-size balance sheet, total assets is 100 percent and every other number is a percentage of total assets. Answer the following questions: Fiscal 2020 Fiscal 2019 Tesla Corporation (ended Dec 31, 2020) (ended Dec. 31, 2019) What percent of total assets are current assets? Which current asset line item (ignore totals) has the largest balance? What percent of total assets are long- term assets? (hint: requires a Which long-term asset line item (ignore totals) has the largest balance? + What percent of total assets are current liabilities? Which current liability line item (ignore totals) has the largest balance? What percent of total assets are long- term liabilities? (hint: requires a calc.) Which long-term liability line item (ignore totals) has the largest balance? What percent of Total Assets is Total Stockholders' Equity? Does Tesla finance its assets mostly with debt or equity? In chapter 5, we talked about inventory. Refer to "Note 6 - Inventon nn the init Return 1 Vertical Analysis Dec. 31, 2019 2 Dec. 31, 2020 3 4 5 7 8 $ 19,384 37.2% 1,886 3.6% 4,101 7.9% 1,346 2.6% 26,717 51.2% 3,091 5.9% 5,979 11.5% 12,747 24.4% 1,558 3.0% 313 0.6% 207 0.4% 1,536 2.9% 52,148 100.0% $ 6,268 18.3% 1,324 3.9% 3,552 10.4% 959 2.8% 12,103 35.3% 2,447 7.1% 6,138 17.9% 10,396 30.3% 1,218 3.6% 339 1.0% 198 0.6% 1,470 4.3% 34,309 100.0% 16 Tesla, Inc. Consolidated Balance Sheets - USD ($) $ in Millions Current assets Cash and cash equivalents Accounts receivable, net 6 Inventory Prepaid expenses and other current assets Total current assets 9 Operating lease vehicles, net 10 Solar energy systems, net 11 Property, plant and equipment, net 12 Operating lease right-of-use assets 13 Intangible assets, net 14 Goodwill 15 Other non-current assets Total assets 17 Current liabilities 18 Accounts payable 19 Accrued liabilities and other 20 Deferred revenue 21 Customer deposits Current portion of debt and finance leases Total current liabilities 24 Debt and finance leases, net of current portion 25 Deferred revenue, net of current portion 26 Other long-term liabilities 27 Total liabilities 28 Commitments and contingencies (Note 16) 29 Redeemable noncontrolling interests in subsidiaries 30 Convertible senior notes (Note 12) 31 Stockholders' equity Preferred stock; $0.001 par value: 100 shares authorized; no shares issued and outstanding Common stock; $0.001 par value: 2,000 shares authorized; [1 960 and 905 shares issued and outstanding as of December 31, 2020 and December 31, 2019, respectively 22 6,051 21.3% 3,855 13.6% 1,458 5.1% 752 2.6% 2,132 7.5% 14,248 50.1% 9,556 33.6% 1,284 4.5% 3,330 11.7% 28,418 100.0% T 3,771 14.4% 3,222 12.3% 1,163 4.4% 726 2.8% 1,785 6.8% 10,667 40.7% 11,634 44,4% 1,207 4.6% 2,691 10.3% 26,199 100.0% 23 643 604 51 1.2% 0.1% 1.9% 0.0% 32 1 0.0% 1 0.0% 33 27,260 52.3% 12,736 Additional paid-in capital 37.1% 12 0 34 35 Accumulated other comprehensive income (loss) Accumulated deficit 363 0.7% (5,399) -10.4% (36) -0.1% (6,083) -17.7% Inc. Peturn Dec. 31, 2020 1,345 2:076 26,717 51.2% 3,091 5.9% 5,979 11.5% 12,747 24.4% 1,558 3.0% 313 0.6% 207 0.4% 1,536 2.9% 52,148 100.0% Vertical Analysis Dec. 31, 2019 959 2076 12,103 35.3% 2,447 7.1% 6,138 17.9% 10,396 30.3% 1,218 3.6% 339 1.0% 198 0.6% 1,470 4.3% 34,309 100.0% Consolidated Balance Sheets - USD ($) $ in Millions Prepara expertses and other current assers Total current assets Operating lease vehicles, net Solar energy systems, net Property, plant and equipment, net Operating lease right-of-use assets Intangible assets, net Goodwill Other non-current assets Total assets Current liabilities Accounts payable Accrued liabilities and other Deferred revenue Customer deposits Current portion of debt and finance leases Total current liabilities Debt and finance leases, net of current portion Deferred revenue, net of current portion Other long-term liabilities Total liabilities Commitments and contingencies (Note 16) Redeemablenoncontrolling Interests in subsidiaries Convertible senior notes (Note 12) Stockholders' equity Preferred stock: $0.001 par value: 100 shares authorized; no shares issued and outstanding Common stock; $0.001 par value; 2,000 shares authorized (1 960 and 905 shares issued and outstanding as of December 31, 2020 and December 31, 2019, respectively 6,051 21.3% 3,855 13.6% 1,458 5.1% 752 2.6% 2,132 7.5% 14,248 50.1% 9,556 33.6% 1,284 4.5% 3,330 11.7% 28,418 100.0% 3,771 14.4% 3,222 12.3% 1,163 4.4% 726 2.8% 1,785 6.8% 10,667 40.7% 11,634 44.4% 1,207 4.6% 2,691 10.3% 26,199 100.0% 604 51 643 1.2% 0.1% 1.9% 0.0% + 1 0.0% 1 0.0% 27,260 52.3% 12,736 11 2 37.1% Additional paid-in capital Accumulated other comprehensive Income (loss) Accumulated deficit Total stockholders' equity Noncontrolling interests in subsidiaries Total liabilities and equity 363 0.7% (5,399) -10.4% 22,225 42.6% 850 1.6% 52,148 100.0% (36) -0.1% (6,083) -17.7% 6,618 19.3% 849 2.5% 34,309 100.0%