Answered step by step
Verified Expert Solution
Question
1 Approved Answer
Need a ratio analysis with: GPM- gross profit margin ratio OPM- operating profit margin ratio NPM- net profit margin ratio ROA- return on assets ratio
Need a ratio analysis with:
GPM- gross profit margin ratio
OPM- operating profit margin ratio
NPM- net profit margin ratio
ROA- return on assets ratio
ROE- retunr on equity ratio
D/A- debt to assets ratio
D/E- debt to equity ratio
TIE- times interested earned ratio
INV TO- inventory turnover ratio


FOR EACH YEAR PLEASE!! (2013-2017)
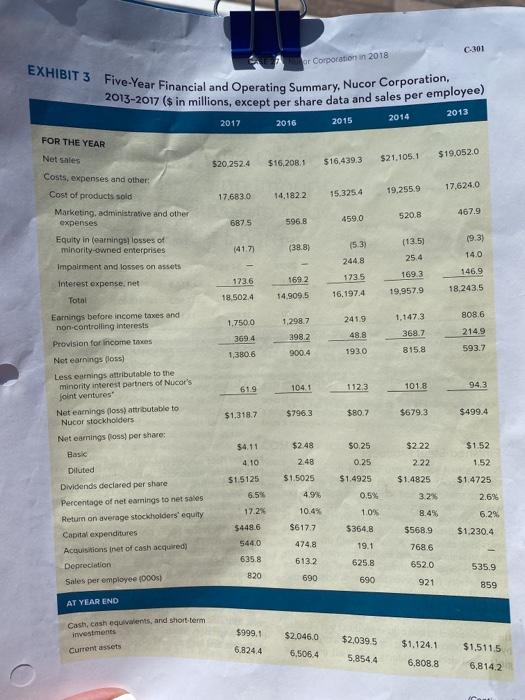
C.001 er Corporation in 2018 EXHIBIT 3 Five-Year Financial and Operating Summary, Nucor Corporation, 2013-2017 ($ in millions, except per share data and sales per employee) 2017 2016 2014 2013 2015 520.252.4 $19.0520 $16.208.1 $16,439.3 $21.105.1 FOR THE YEAR Net sales Costs, expenses and other Cost of products sold Marketing, administrative and other expenses Equity in fearnings) losses of minority-owned enterprises 17.624.0 17.683.0 14.182.2 19.255.9 15.325.4 467.9 520.8 459.0 6875 596.8 (9.3) 15.3) (417) (388) (135) 25.4 14.0 2448 Impairment and losses on assets 1469 1736 1692 1735 interest expense.net Total 169.3 19.957.9 18.243.5 18.502.4 14.909.5 16.1974 8086 1,298.7 241.9 1.147.3 1.750.0 3694 2982 48.8 368.7 214.9 593.7 1,380.6 900.4 1930 815.8 61.9 104.1 112.3 101.8 94.3 $1,318.7 $796.3 $80.7 $679,3 $499.4 $4.11 $2.48 Earnings before income taxes and non-controlling interests Provision for income taxes Not earnings (loss) Less carnings attributable to the minority interest partners of Nucor's joint ventures Net earnings floss) attributable to Nucor stockholders Net earnings poss) per share: Basic Diluted Dividends declared per share Percentage of net earnings to net sales Return on average stockholders' equity Capital expenditures Acquisitions inet of cash acquired) Depreciation Sales per employee 1000 $2 22 $0.25 0.25 $1.52 1,52 4.10 2.48 $1.5125 $1.4925 $1.5025 4.9% 2.22 $1.4825 3.2% $1.4725 6.5% 0.5% 2.6% 10.4% 8.4% 6.2% 17.24 $448.6 1.0% $364.8 19.1 5568.9 $617.7 474.8 $1,230.4 544.0 768.6 635.8 6132 625.8 652.0 535.9 820 690 690 921 859 AT YEAR END $999.1 Cash, cash equivalents, and short-term investments Current assets $2,046.0 6,506.4 $1.124.1 6.824.4 $2.039,5 5,8544 $1,511.5 6,814.2 6,808.8Step by Step Solution
There are 3 Steps involved in it
Step: 1

Get Instant Access to Expert-Tailored Solutions
See step-by-step solutions with expert insights and AI powered tools for academic success
Step: 2

Step: 3

Ace Your Homework with AI
Get the answers you need in no time with our AI-driven, step-by-step assistance
Get Started


