Answered step by step
Verified Expert Solution
Question
1 Approved Answer
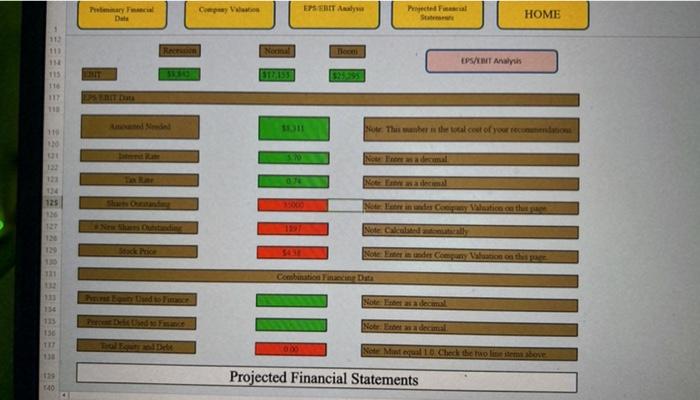
Need answer for the green part! 1 112 111 115 116 117 118 119 120 121 122 123 124 125 126 127 129 331 132
Need answer for the green part! 


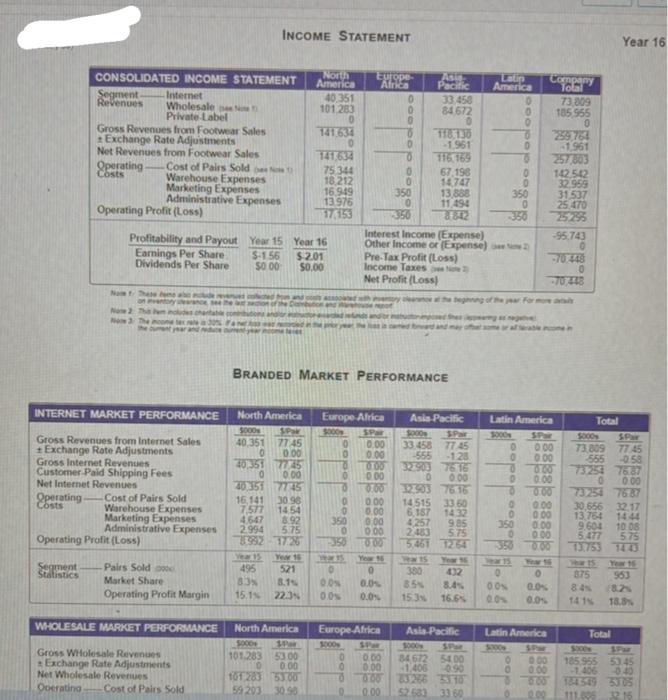
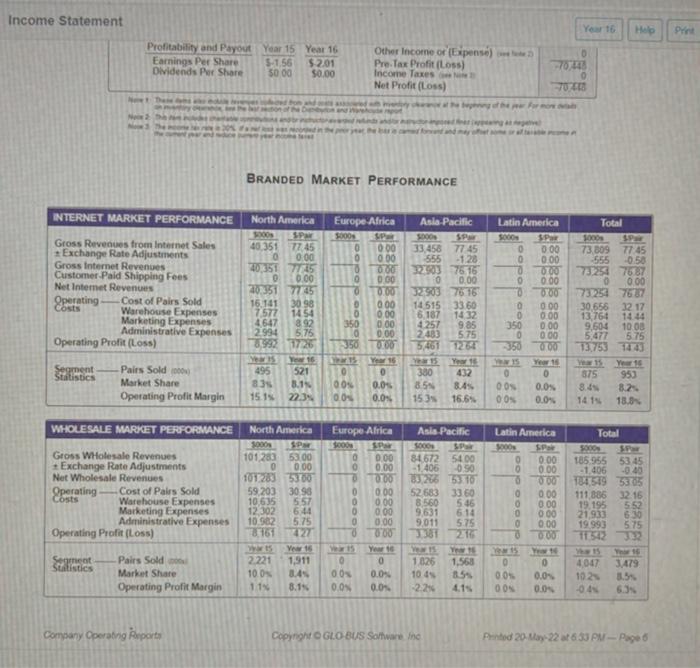
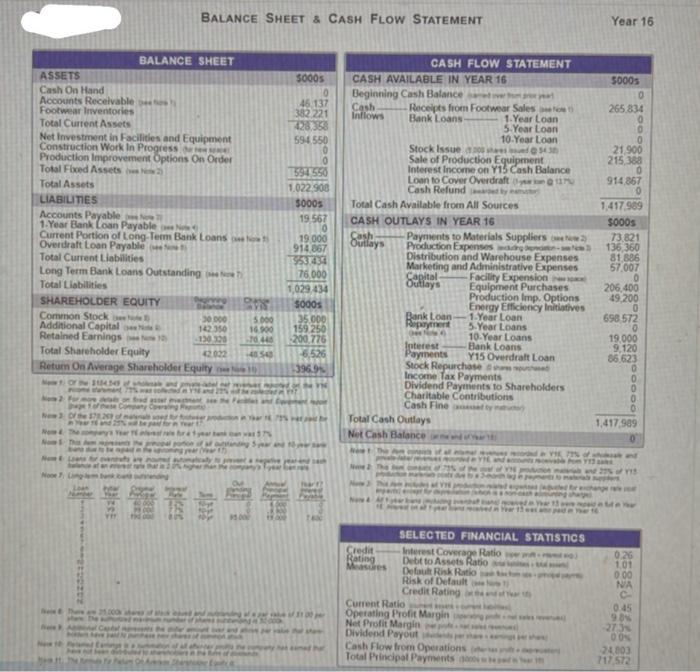
1 112 111 115 116 117 118 119 120 121 122 123 124 125 126 127 129 331 132 133 154 135 136 137 138 1129 140 Preliminary Financial Data EENIT EPS FRIT DRA 58343 Stock Price Provst Equity Used to Finance Company Valuation Normal $17,155 EPS IT Analy Bloomi Projected Financial HOME EPS/BIT Analysis Note: This manber is the total cost of your recommendations Note Entre as a decimal Note Eat as a decimal Note Calculated anomatically Note Enter in under Company Valuation on this page Note: Enter as a decimal Note Enter as a decimal Note Mint equal 1.0 Check the two line stems above 5.70 Combination Financing Data 800 Projected Financial Statements INCOME STATEMENT North America Europe Africa 40,351 101,283 0 141.634 0 141,634 75.344 18,212 16.949 13.976 17,153 CONSOLIDATED INCOME STATEMENT Segment Internet Revenues Wholesale pe Private Label Gross Revenues from Footwear Sales Exchange Rate Adjustments Net Revenues from Footwear Sales Operating- Costs Cost of Pairs Sold Warehouse Expenses Marketing Expenses Administrative Expenses Operating Profit (Loss) Profitability and Payout Year 15 Earnings Per Share Dividends Per Share Nom Thase Not 2: The Nom 3 The the current INTERNET MARKET PERFORMANCE Gross Revenues from Internet Sales + Exchange Rate Adjustments Gross Internet Revenues Customer Paid Shipping Fees Net Internet Revenues Operating Costs Cost of Pairs Sold Warehouse Expenses Marketing Expenses Administrative Expenses Operating Profit (Loss) Segment Pairs Sold Statistics Market Share Operating Profit Margin WHOLESALE MARKET PERFORMANCE Gross Wholesale Revenues Exchange Rate Adjustments Net Wholesale Revenues Operating Cost of Pairs Sold 0 0 0 Latin Asia Pacific America 33.458 84.672 0 118,130 -1.961 116.169 67.198 0 14,747 350 13,888 350 0 11.494 0 350 8842 -350 Interest Income (Expense) Other Income or (Expense) e 2) Pre-Tax Profit (Loss) Income Taxes Net Profit (Loss) 0 0 to oc Year 16 $-1.56 $2.01 $0.00 $0.00 BRANDED MARKET PERFORMANCE North America Europe Africa Asia Pacific $000 SPair 5000 SPar 5000 SPar 40.351 77.45 0.00 33.458 77.45 0 0.00 0.00 -555 -1.28 40,351 77:45 0.00 32.903 76.16 0 0.00 0.00 0 0.00 40.351 77:45 0.00 32.903 76.16 16,141 30.96 0.00 14515 33.60 14.32 7,577 14.54 0.00 6,187 4.647 8.92 350 0.00 4.257 9.85 2.994 5.75 0 0:00 2,483 5.75 8992-17:26 -350 0.00 5,461 1264 Year 15 Year 16 Year 16 495 521 0 0 380 432 83% 0.0% 0.0% 8.5% 8.4% 15.1% 22.3% 0.0% 0.0% 15.3% 16.6% Europe Africa Asia-Pacific North America 5000 SPar 5000 101,283 53.00 0 0.00 101283 53.00 59 203 30.90 0.00 84.672 54.00 0.00 1,406 -0.90 0:00 33.266 53.10 0.00 52.683 33 60 d 0 ..dedol 200 0 0 1000 Company Total 73,009 105,955 0 259,764 -1,961 257,803 142.542 32.959 31,537 25,470 -95.743 0 -70.448 0 -70448 PONP Latin America Total 3000 SPar 5000 SPar 0.00 73.809 77.45 -555 -0.58 0.00 000 73254 76.87 0.00 0 0.00 0.00 73.254 76.87 0.00 30,656 32.17 000 13,764 14:44 350 0.00 9.604 10.08 0 0.00 5.477 5.75 13.753 14:43 0.00 har 15 Year 15 0 875 953 0.0% 8.4% (8.2% 0.0% 14:1 18.8% Total 5000 SPar 185.955 53.45 -1,406 -0.40 184549 33.05 111.006 32. 16 0 0.0% 2.0% Latin America 0.00 0.00 8-000 0 0.00 Year 16 Income Statement Profitability and Payout Earnings Per Share Dividends Per Share New Nex 2 INTERNET MARKET PERFORMANCE Gross Revenues from Internet Sales Exchange Rate Adjustments Gross Internet Revenues Customer-Paid Shipping Fees Net Internet Revenues Operating Operating Profit (Loss) Segment -Pairs Sold (000) Statistics Market Share Operating Profit Margin WHOLESALE MARKET PERFORMANCE Gross Wholesale Revenues Exchange Rate Adjustments Net Wholesale Revenues- Operating. Cost of Pairs Sold Costs Warehouse Expenses Marketing Expenses Administrative Expenses Operating Profit (Loss) Segment Pairs Sold o Statistics Market Share Operating Profit Margin Company Operating Reports Cost of Pairs Sold Warehouse Expenses Marketing Expenses Administrative Expenses Other Income or (Expense) Pre-Tax Profit (Loss) Income Taxes Net Profit (Loss) on and forand BRANDED MARKET PERFORMANCE North America Europe Africa Asia-Pacific 5000 S-Par 5000 SPar 40,351 77,45 0 SPar 0:00 0.00 0.00 33,458 77.45 555 -1.28 32.903 76 16 0 40,351 7745 0.00 0.00 0.00 0.00 76 16 40.351 77.45 0.00 32.903 16.141 30 98 0.00 14.515 33.60 7,577 14.54 0 0.00 6,187 14.32 4,647 8.92 350 0.00 4.257 9.85 2.994 5.75 0 0.00 2.483 5.75 8.992 17:26 350 0.00 5,461 1264 Year 15 Year 16 Year 15 495 521 380 432 Year 16 0 0 0.0% 0.0% 0.00 0.0% 83% 8.1% 8.5% 8.4% 15.3% 16.6% 15.1% 22.3% North America Asia-Pacific 5000 S-Pair SPar 1000 101,283 53.00 0 0.00 101.283 53.00 59,203 30.96 557 Europe Africa $000 Spar 0 0.00 0 0.00 0 0.00 0 0.00 84.672 54.00 -1,406 0.90 83,266 53.10 52.683 33 60 8,560 5.46 6.14 5.75 3381 216 0.00 10,635 12,302 644 10.982 5.75 9.631 0.00 0.00 000 9.011 8.161 427 Year 16 Year 10 0 2,221 1,911 0 10.0% 8.4% 0.0% Year 15 Year 16 1.826 1,568 10.4% 85% -2.2% 0.0% 8.1% 0.0% 0.0% 1.1% 4.1% Copyright GLO-BUS Software inc Year 15 $-1.56 50,00 0 Year 16 $2.01 $0.00 doood 0 Year 16 0 -70, 448 0 70418 being of the per For more Teringat pe 000 Help Latin America Total 5000 SPar 1000 0 0.00 0.00 0.00 0 S.Par 73,809 77.45 555 -0.50 73.254 76.87 0 0.00 73.254 7687 30.656 32.17 14.44 0 0.00 O 0.00 0 0.00 0 0.00 13,764 350 0.00 9,604 10.08 0 0.00 5,477 5.75 -350 0.00 13,753 14:43 Your 15 Year 16 0 0 0.0% 0.0% 00% 0.0% Year 15 Year 15 875 953 8.4% 8.2% 14.1% 18.8% Latin America Total SPor $Par 5000 0.00 185.955 53.45 0.00 O 000 0 0 -1.406 -0.40 184,549 53.05 111,886 32.16 19,195 5.52 21,933 6:30 19,993 5.75 0.00 0.00 0.00 0.00 0.00 Your t 0 11.542 0 O 15 0 0.0% 3:32 4,047 3,479 9.00 10.2% 8.5% 00% 0.0% 04% 6.3% Printed 20-May-22 at 6.33 PM-Page 6 Print BALANCE SHEET & CASH FLOW STATEMENT 5000s CASH AVAILABLE IN YEAR 16 Beginning Cash Balance Cash Inflows BALANCE SHEET ASSETS Cash On Hand Accounts Receivable pesh Footwear Inventories Total Current Assets Net Investment in Facilities and Equipment Construction Work In Progress Production Improvement Options On Order Total Fixed Assets) Total Assets LIABILITIES Accounts Payable 1-Year Bank Loan Payable Ne Current Portion of Long-Term Bank Loansow Overdraft Loan Payable t Total Current Liabilities Long Term Bank Loans Outstanding t Total Liabilities SHAREHOLDER EQUITY www B 30,000 5.000 Common Stock I Additional Capital Retained Earnings 142.350 16.900 130.328 70,445 Total Shareholder Equity 42.022 40 540 Return On Average Shareholder Equity 1104.30 of sholak and persing Nomi Now S Now & L None There 25.000 f 95.000 10 46.137 382 221 428.358 594.550 0 0 594.550 1.022.908 5000s 19.567 0 19.000 914,867 953.434 76,000 1,029.434 5000s 35.000 159.250 200,776 6.526 396.9% be Nare 8835 sind h CASH FLOW STATEMENT your Receipts from Footwear Sales et Bank Loans- 1-Year Loan 5-Year Loan 10-Year Loan Stock Issue 200 hes@54.38 Sale of Production Equipment Interest Income on Y15 Cash Balance Loan to Cover Overdraft 229 Cash Refund at by Total Cash Available from All Sources CASH OUTLAYS IN YEAR 16 Sulay's Cash 2) Payments to Materials Suppliers Production Expenses age- Distribution and Warehouse Expenses Marketing and Administrative Expenses Capital- Facility Expension Outlays Equipment Purchases Production Imp. Options Energy Efficiency Initiatives 1-Year Loan HOM Bank Loan- Repayment 5-Year Loans w Now 10-Year Loans Interest Bank Loans Payments Y15 Overdraft Loan Stock Repurchased Income Tax Payments Dividend Payments to Shareholders Charitable Contributions Cash Fine a 73.821 136,360 81,886 57.007 0 206,400 49,200 0 698,572 0 19,000 9,120 86,623 0 0 0 0 0 1,417,909 cord VIE, 77% of skand bom Y13 and 275 VIS SELECTED FINANCIAL STATISTICS (NO) Interest Coverage Ratio Debt to Assets Ratio Default Risk Ratio Risk of Default Credit Rating Total Cash Outlays Net Cash Balance Nove 2 how & Credit Rating Measures Current Ratio Operating Profit Margin Net Profit Margin Dividend Payout Cash Flow from Operations Total Principal Payments as Year 16 $000s 0 265.834 0 10 0 21,900 215,388 0 914.867 0 1,417,989 $000s ww 0.26 1.01 0:00 NA C 0.45 986 -27.3% 700 24,003 717,572 1 112 111 115 116 117 118 119 120 121 122 123 124 125 126 127 129 331 132 133 154 135 136 137 138 1129 140 Preliminary Financial Data EENIT EPS FRIT DRA 58343 Stock Price Provst Equity Used to Finance Company Valuation Normal $17,155 EPS IT Analy Bloomi Projected Financial HOME EPS/BIT Analysis Note: This manber is the total cost of your recommendations Note Entre as a decimal Note Eat as a decimal Note Calculated anomatically Note Enter in under Company Valuation on this page Note: Enter as a decimal Note Enter as a decimal Note Mint equal 1.0 Check the two line stems above 5.70 Combination Financing Data 800 Projected Financial Statements INCOME STATEMENT North America Europe Africa 40,351 101,283 0 141.634 0 141,634 75.344 18,212 16.949 13.976 17,153 CONSOLIDATED INCOME STATEMENT Segment Internet Revenues Wholesale pe Private Label Gross Revenues from Footwear Sales Exchange Rate Adjustments Net Revenues from Footwear Sales Operating- Costs Cost of Pairs Sold Warehouse Expenses Marketing Expenses Administrative Expenses Operating Profit (Loss) Profitability and Payout Year 15 Earnings Per Share Dividends Per Share Nom Thase Not 2: The Nom 3 The the current INTERNET MARKET PERFORMANCE Gross Revenues from Internet Sales + Exchange Rate Adjustments Gross Internet Revenues Customer Paid Shipping Fees Net Internet Revenues Operating Costs Cost of Pairs Sold Warehouse Expenses Marketing Expenses Administrative Expenses Operating Profit (Loss) Segment Pairs Sold Statistics Market Share Operating Profit Margin WHOLESALE MARKET PERFORMANCE Gross Wholesale Revenues Exchange Rate Adjustments Net Wholesale Revenues Operating Cost of Pairs Sold 0 0 0 Latin Asia Pacific America 33.458 84.672 0 118,130 -1.961 116.169 67.198 0 14,747 350 13,888 350 0 11.494 0 350 8842 -350 Interest Income (Expense) Other Income or (Expense) e 2) Pre-Tax Profit (Loss) Income Taxes Net Profit (Loss) 0 0 to oc Year 16 $-1.56 $2.01 $0.00 $0.00 BRANDED MARKET PERFORMANCE North America Europe Africa Asia Pacific $000 SPair 5000 SPar 5000 SPar 40.351 77.45 0.00 33.458 77.45 0 0.00 0.00 -555 -1.28 40,351 77:45 0.00 32.903 76.16 0 0.00 0.00 0 0.00 40.351 77:45 0.00 32.903 76.16 16,141 30.96 0.00 14515 33.60 14.32 7,577 14.54 0.00 6,187 4.647 8.92 350 0.00 4.257 9.85 2.994 5.75 0 0:00 2,483 5.75 8992-17:26 -350 0.00 5,461 1264 Year 15 Year 16 Year 16 495 521 0 0 380 432 83% 0.0% 0.0% 8.5% 8.4% 15.1% 22.3% 0.0% 0.0% 15.3% 16.6% Europe Africa Asia-Pacific North America 5000 SPar 5000 101,283 53.00 0 0.00 101283 53.00 59 203 30.90 0.00 84.672 54.00 0.00 1,406 -0.90 0:00 33.266 53.10 0.00 52.683 33 60 d 0 ..dedol 200 0 0 1000 Company Total 73,009 105,955 0 259,764 -1,961 257,803 142.542 32.959 31,537 25,470 -95.743 0 -70.448 0 -70448 PONP Latin America Total 3000 SPar 5000 SPar 0.00 73.809 77.45 -555 -0.58 0.00 000 73254 76.87 0.00 0 0.00 0.00 73.254 76.87 0.00 30,656 32.17 000 13,764 14:44 350 0.00 9.604 10.08 0 0.00 5.477 5.75 13.753 14:43 0.00 har 15 Year 15 0 875 953 0.0% 8.4% (8.2% 0.0% 14:1 18.8% Total 5000 SPar 185.955 53.45 -1,406 -0.40 184549 33.05 111.006 32. 16 0 0.0% 2.0% Latin America 0.00 0.00 8-000 0 0.00 Year 16 Income Statement Profitability and Payout Earnings Per Share Dividends Per Share New Nex 2 INTERNET MARKET PERFORMANCE Gross Revenues from Internet Sales Exchange Rate Adjustments Gross Internet Revenues Customer-Paid Shipping Fees Net Internet Revenues Operating Operating Profit (Loss) Segment -Pairs Sold (000) Statistics Market Share Operating Profit Margin WHOLESALE MARKET PERFORMANCE Gross Wholesale Revenues Exchange Rate Adjustments Net Wholesale Revenues- Operating. Cost of Pairs Sold Costs Warehouse Expenses Marketing Expenses Administrative Expenses Operating Profit (Loss) Segment Pairs Sold o Statistics Market Share Operating Profit Margin Company Operating Reports Cost of Pairs Sold Warehouse Expenses Marketing Expenses Administrative Expenses Other Income or (Expense) Pre-Tax Profit (Loss) Income Taxes Net Profit (Loss) on and forand BRANDED MARKET PERFORMANCE North America Europe Africa Asia-Pacific 5000 S-Par 5000 SPar 40,351 77,45 0 SPar 0:00 0.00 0.00 33,458 77.45 555 -1.28 32.903 76 16 0 40,351 7745 0.00 0.00 0.00 0.00 76 16 40.351 77.45 0.00 32.903 16.141 30 98 0.00 14.515 33.60 7,577 14.54 0 0.00 6,187 14.32 4,647 8.92 350 0.00 4.257 9.85 2.994 5.75 0 0.00 2.483 5.75 8.992 17:26 350 0.00 5,461 1264 Year 15 Year 16 Year 15 495 521 380 432 Year 16 0 0 0.0% 0.0% 0.00 0.0% 83% 8.1% 8.5% 8.4% 15.3% 16.6% 15.1% 22.3% North America Asia-Pacific 5000 S-Pair SPar 1000 101,283 53.00 0 0.00 101.283 53.00 59,203 30.96 557 Europe Africa $000 Spar 0 0.00 0 0.00 0 0.00 0 0.00 84.672 54.00 -1,406 0.90 83,266 53.10 52.683 33 60 8,560 5.46 6.14 5.75 3381 216 0.00 10,635 12,302 644 10.982 5.75 9.631 0.00 0.00 000 9.011 8.161 427 Year 16 Year 10 0 2,221 1,911 0 10.0% 8.4% 0.0% Year 15 Year 16 1.826 1,568 10.4% 85% -2.2% 0.0% 8.1% 0.0% 0.0% 1.1% 4.1% Copyright GLO-BUS Software inc Year 15 $-1.56 50,00 0 Year 16 $2.01 $0.00 doood 0 Year 16 0 -70, 448 0 70418 being of the per For more Teringat pe 000 Help Latin America Total 5000 SPar 1000 0 0.00 0.00 0.00 0 S.Par 73,809 77.45 555 -0.50 73.254 76.87 0 0.00 73.254 7687 30.656 32.17 14.44 0 0.00 O 0.00 0 0.00 0 0.00 13,764 350 0.00 9,604 10.08 0 0.00 5,477 5.75 -350 0.00 13,753 14:43 Your 15 Year 16 0 0 0.0% 0.0% 00% 0.0% Year 15 Year 15 875 953 8.4% 8.2% 14.1% 18.8% Latin America Total SPor $Par 5000 0.00 185.955 53.45 0.00 O 000 0 0 -1.406 -0.40 184,549 53.05 111,886 32.16 19,195 5.52 21,933 6:30 19,993 5.75 0.00 0.00 0.00 0.00 0.00 Your t 0 11.542 0 O 15 0 0.0% 3:32 4,047 3,479 9.00 10.2% 8.5% 00% 0.0% 04% 6.3% Printed 20-May-22 at 6.33 PM-Page 6 Print BALANCE SHEET & CASH FLOW STATEMENT 5000s CASH AVAILABLE IN YEAR 16 Beginning Cash Balance Cash Inflows BALANCE SHEET ASSETS Cash On Hand Accounts Receivable pesh Footwear Inventories Total Current Assets Net Investment in Facilities and Equipment Construction Work In Progress Production Improvement Options On Order Total Fixed Assets) Total Assets LIABILITIES Accounts Payable 1-Year Bank Loan Payable Ne Current Portion of Long-Term Bank Loansow Overdraft Loan Payable t Total Current Liabilities Long Term Bank Loans Outstanding t Total Liabilities SHAREHOLDER EQUITY www B 30,000 5.000 Common Stock I Additional Capital Retained Earnings 142.350 16.900 130.328 70,445 Total Shareholder Equity 42.022 40 540 Return On Average Shareholder Equity 1104.30 of sholak and persing Nomi Now S Now & L None There 25.000 f 95.000 10 46.137 382 221 428.358 594.550 0 0 594.550 1.022.908 5000s 19.567 0 19.000 914,867 953.434 76,000 1,029.434 5000s 35.000 159.250 200,776 6.526 396.9% be Nare 8835 sind h CASH FLOW STATEMENT your Receipts from Footwear Sales et Bank Loans- 1-Year Loan 5-Year Loan 10-Year Loan Stock Issue 200 hes@54.38 Sale of Production Equipment Interest Income on Y15 Cash Balance Loan to Cover Overdraft 229 Cash Refund at by Total Cash Available from All Sources CASH OUTLAYS IN YEAR 16 Sulay's Cash 2) Payments to Materials Suppliers Production Expenses age- Distribution and Warehouse Expenses Marketing and Administrative Expenses Capital- Facility Expension Outlays Equipment Purchases Production Imp. Options Energy Efficiency Initiatives 1-Year Loan HOM Bank Loan- Repayment 5-Year Loans w Now 10-Year Loans Interest Bank Loans Payments Y15 Overdraft Loan Stock Repurchased Income Tax Payments Dividend Payments to Shareholders Charitable Contributions Cash Fine a 73.821 136,360 81,886 57.007 0 206,400 49,200 0 698,572 0 19,000 9,120 86,623 0 0 0 0 0 1,417,909 cord VIE, 77% of skand bom Y13 and 275 VIS SELECTED FINANCIAL STATISTICS (NO) Interest Coverage Ratio Debt to Assets Ratio Default Risk Ratio Risk of Default Credit Rating Total Cash Outlays Net Cash Balance Nove 2 how & Credit Rating Measures Current Ratio Operating Profit Margin Net Profit Margin Dividend Payout Cash Flow from Operations Total Principal Payments as Year 16 $000s 0 265.834 0 10 0 21,900 215,388 0 914.867 0 1,417,989 $000s ww 0.26 1.01 0:00 NA C 0.45 986 -27.3% 700 24,003 717,572 


Step by Step Solution
There are 3 Steps involved in it
Step: 1

Get Instant Access to Expert-Tailored Solutions
See step-by-step solutions with expert insights and AI powered tools for academic success
Step: 2

Step: 3

Ace Your Homework with AI
Get the answers you need in no time with our AI-driven, step-by-step assistance
Get Started


