

Answered step by step
Verified Expert Solution
Question
1 Approved Answer
NEED ANSWERS e to m. Failiure to answer all results in thumbs down. Here are simplified financlal statements for Phone Corporation in a recent year
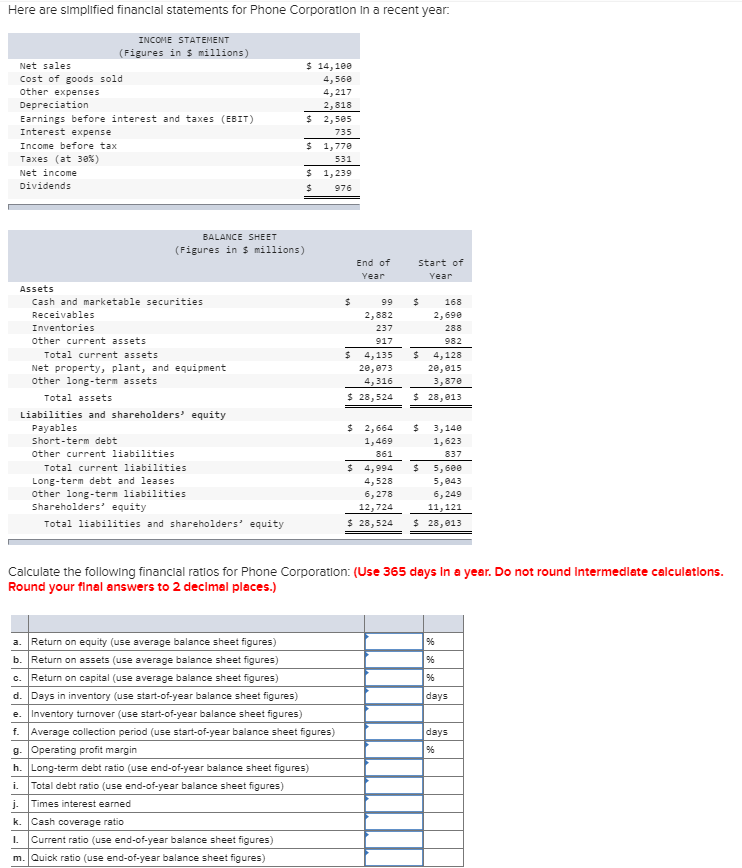
NEED ANSWERS "e to m". Failiure to answer all results in thumbs down.
Here are simplified financlal statements for Phone Corporation in a recent year INCOME STATEMENT (Figures in $ millions) Net sales 14,1ee Cost of goods sold 4,560 Other expenses 4, 217 Depreciation 2,818 Earnings before interest and taxes (EBIT) 2,505 Interest expense 735 $ 1,77e Income before tax Taxes (at 3e%) 531 $ 1,239 Net income Dividends 976 BALANCE SHEET (Figures in s millions) End of Start of Year Year Assets Cash and marketable securities 99 168 Receivables 2,882 2,690 Inventories 237 288 other current assets 917 982 Total current assets 4,135 20,073 4,316 4,128 Net property, plant, and equipment other long-term assets 28, e15 3,87e Total assets 28,013 28,524 Liabilities and shareholders' equity Payables $2,664 3,140 Short-term debt 1,623 1,469 other current liabilities 861 837 Total current liabilities $4,994 5,6ee Long-term debt and leases other long-term liabilities shareholders' equity 4, 528 5,043 6,278 6,249 12,724 11,121 Total liabilities and shareholders' equity 28,524 28,013 Calculate the following financlal ratios for Phone Corporation: (Use 365 days in a year. Do not round intermedlate calculations. Round your final answers to 2 decimel places.) a. Return on equity (use sverage balance sheet figures) 96 b. Return on assets (use average balsnce sheet figures) c. Return on capital (use average balance sheet figures) d. Days in inventory (use start-of-year balance sheet figures) days e.Inventory turnover (use start-of-year balance sheet figures) f.Average collection period (use start-of-year balance sheet figures) days gOpersting profit margin h. Long-term debt ratio (use end-of-year balance sheet figures) Total debt ratio (use end-of-year balance sheet figures) i Times interest earned j- k. Cash coverage ratio Current ratio (use end-of-year balance sheet figures)Step by Step Solution
There are 3 Steps involved in it
Step: 1

Get Instant Access to Expert-Tailored Solutions
See step-by-step solutions with expert insights and AI powered tools for academic success
Step: 2

Step: 3
Ace Your Homework with AI
Get the answers you need in no time with our AI-driven, step-by-step assistance
Get Started
Asset Allocation And International Investments
Authors: G. Gregoriou
1st Edition
023001917X,0230626513