Answered step by step
Verified Expert Solution
Question
1 Approved Answer
need assistance or guidance for this question for my assignment next week (a) Describe in your own words how you would expect the data points
need assistance or guidance for this question for my assignment next week 

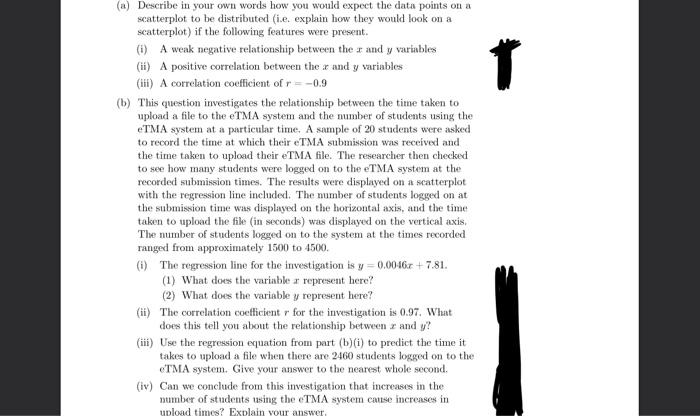
(a) Describe in your own words how you would expect the data points on a scatterplot to be distributed (i.e. explain how they would look on a scatterplot) if the following features were present. (i) A weak negative relationship between the r and y variables (ii) A positive correlation between the ax and y variables (iii) A correlation coefficient of r = -0.9 (b) This question investigates the relationship between the time taken to upload a file to the eTMA system and the number of students using the eTMA system at a particular time. A sample of 20 students were asked to record the time at which their eTMA submission was received and the time taken to upload their eTMA file. The researcher then checked to see how many students were logged on to the eTMA system at the recorded submission times. The results were displayed on a scatterplot with the regression line included. The number of students logged on at the submission time was displayed on the horizontal axis, and the time taken to upload the file (in seconds) was displayed on the vertical axis. The number of students logged on to the system at the times recorded ranged from approximately 1500 to 4500. (i) The regression line for the investigation is y=0.0046z+7.81. (1) What does the variable r represent here? (2) What does the variable y represent here? (ii) The correlation coefficient r for the investigation is 0.97. What does this tell you about the relationship between z and y? (iii) Use the regression equation from part (b)(i) to predict the time it takes to upload a file when there are 2460 students logged on to the eTMA system. Give your answer to the nearest whole second. (iv) Can we conclude from this investigation that increases in the number of students using the eTMA system cause increases in upload times? Explain your answer, (e) (i) Using the same axes, desor graphs of the two equations from part (b). Use an 2-scale from 0 to 30, and choose a g-scale that allows both lines to be seen over this range You may draw your graphs by hand, using squared paper, or use Graphplatter. Remember to label the lines with their equations. See the screencast on how to see Graphplotter if you are having difficulty adjusting the limits for the slope and intercept. Include your grips with the rest of your TMA (1) (1) What do the gradients of these lines represent in terms of the situation being modelled? (2) What do the intercepts of these lines represent in terms of the situation being modelled? (d) The lines representing the equations in part (b) intersect. Use your graphs to write down the approximate coordinates of the intersection point. How can the intersection point be interpreted in this model 

Step by Step Solution
There are 3 Steps involved in it
Step: 1

Get Instant Access to Expert-Tailored Solutions
See step-by-step solutions with expert insights and AI powered tools for academic success
Step: 2

Step: 3

Ace Your Homework with AI
Get the answers you need in no time with our AI-driven, step-by-step assistance
Get Started


