

Answered step by step
Verified Expert Solution
Question
1 Approved Answer
NEED EXACT STEPS FOR THIS QUESTION FROM START TO FINISH FOR IT THANK YOU PLEASE WRITE CLEAR 2 Health Insurance Analysis mino 4 Assumption: 5
NEED EXACT STEPS FOR THIS QUESTION FROM START TO FINISH FOR IT THANK YOU PLEASE WRITE CLEAR
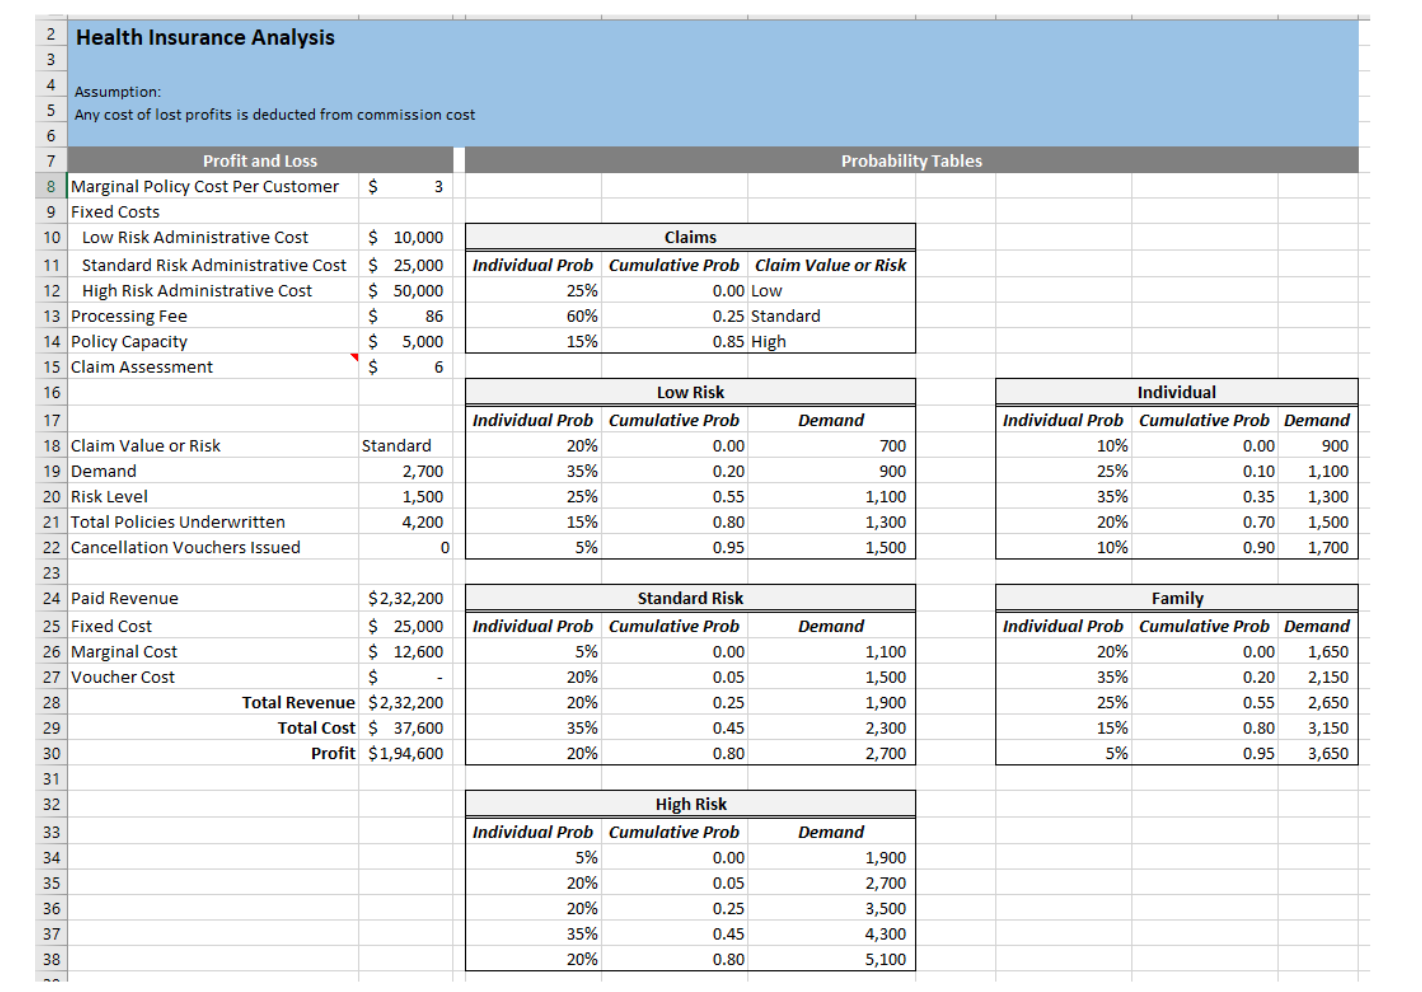
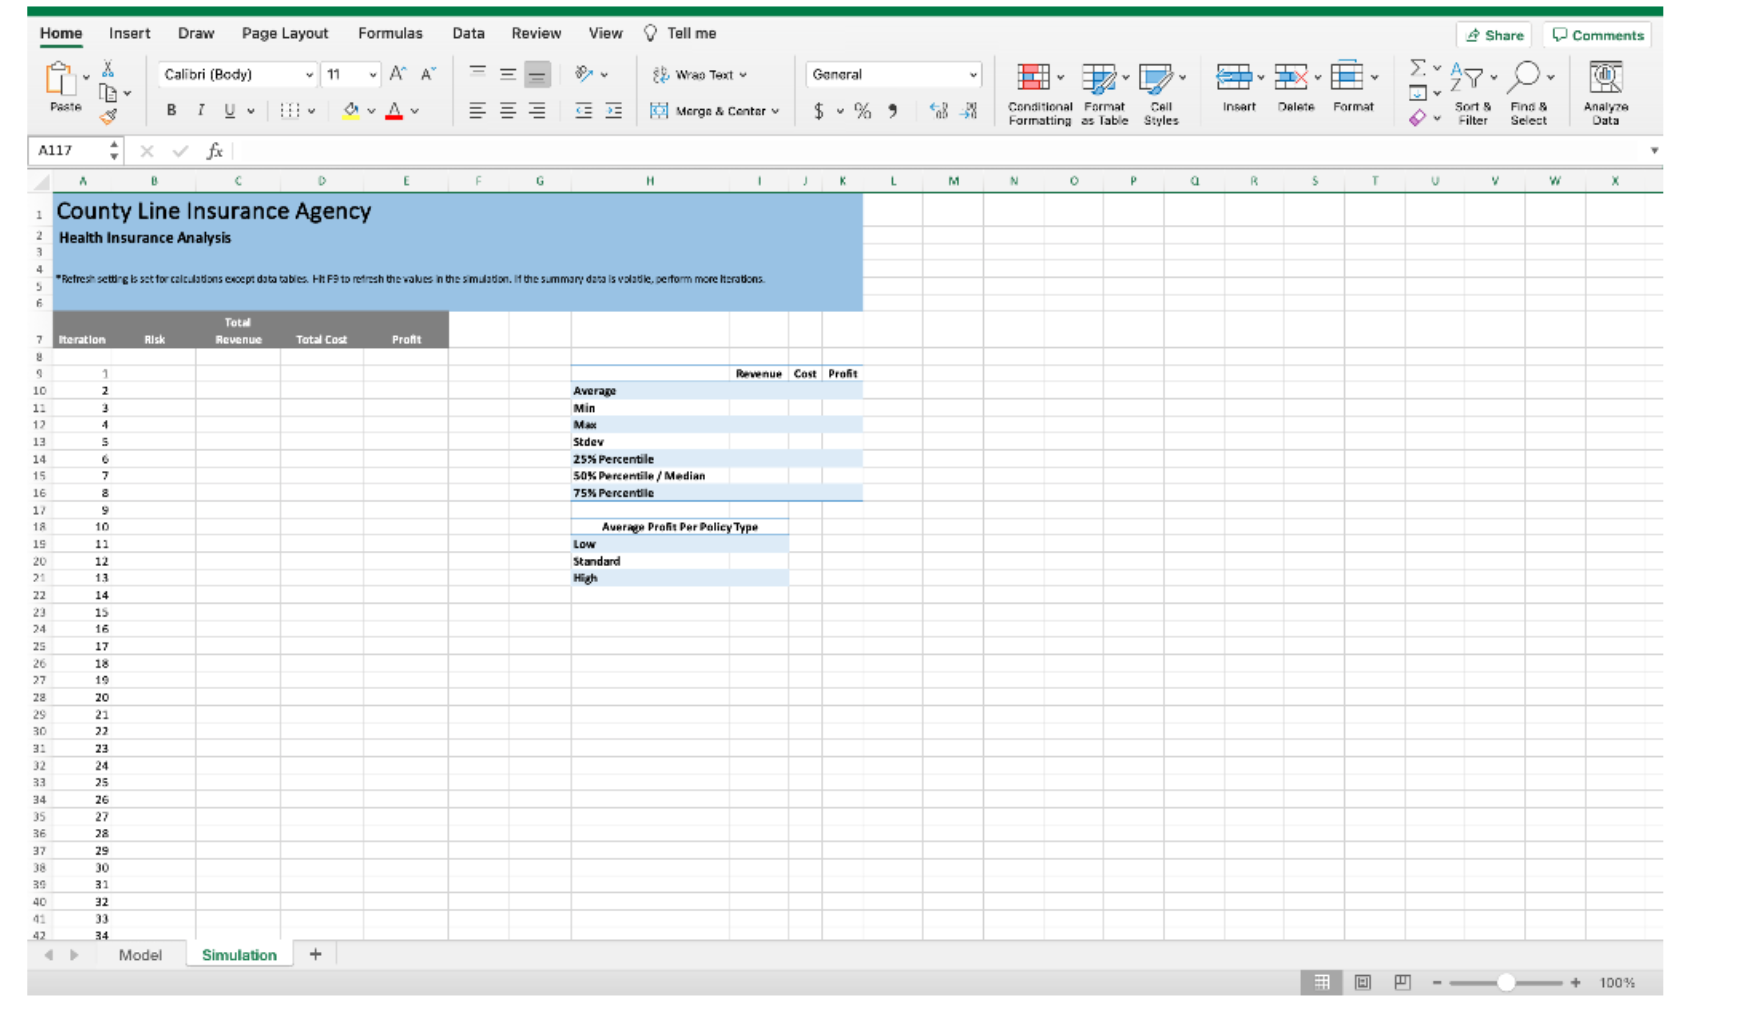
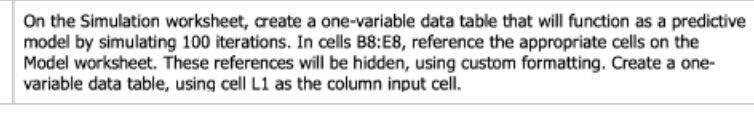
2 Health Insurance Analysis mino 4 Assumption: 5 Any cost of lost profits is deducted from commission cost 6 7 Profit and Loss Probability Tables 8 Marginal Policy Cost Per Customer $ 3 9 Fixed Costs 10 Low Risk Administrative Cost $ 10,000 Claims 11 Standard Risk Administrative Cost $ 25,000 Individual Prob Cumulative Prob Claim Value or Risk 12 High Risk Administrative Cost $ 50,000 25% 0.00 Low 13 Processing Fee $ 86 60% 0.25 Standard 14 Policy Capacity $ 5,000 15% 0.85 High 15 Claim Assessment $ 6 16 Low Risk 17 Individual Prob Cumulative Prob Demand 18 Claim Value or Risk Standard 20% 0.00 700 19 Demand 2,700 35% 0.20 900 20 Risk Level 1,500 25% 0.55 1,100 21 Total Policies Underwritten 4,200 15% 0.80 1,300 22 Cancellation Vouchers Issued 0 5% 0.95 1,500 23 24 Paid Revenue $2,32,200 Standard Risk 25 Fixed Cost $ 25,000 Individual Prob Cumulative Prob Demand 26 Marginal Cost $ 12,600 5% 0.00 1,100 27 Voucher Cost $ 20% 0.05 1,500 28 Total Revenue $2,32,200 20% 0.25 1,900 29 Total Cost $ 37,600 35% 0.45 2,300 30 Profit $ 1,94,600 20% 0.80 2,700 31 32 High Risk 33 Individual Prob Cumulative Prob Demand 34 5% 0.00 1,900 35 20% 0.05 2,700 36 20% 0.25 3,500 37 35% 0.45 4,300 38 20% 0.80 5,100 Individual Individual Prob Cumulative Prob Demand 10% 0.00 900 25% 0.10 1,100 35% 0.35 1,300 20% 0.70 1,500 10% 0.90 1,700 Family Individual Prob Cumulative Prob Demand 20% 0.00 1,650 35% 2,150 25% 0.55 2,650 15% 0.80 3,150 5% 0.95 3,650 0.20 Home Insert Draw Page Layout Formulas Data Review View Tell me Share Comments X Calibri (Body) 11 A A sy Wrao Text General 3 PASTA BIU AVA === Marge & Center 3 $ % ? Insert DAIATA Format Sort Conditional Format Call Formatting as Table Styles Filter Find Select Analyze Data Al17 fx A B D H K L M N O P R s T v w X County Line Insurance Agency 2 Health Insurance Analysis Refresh setting is set for calculations coept data tables. Fit F9 to refresh the values in the simulation. If the summary data is volatile, perform more Iterations 5 G Tot Revenue Iteration Risk Total Cod Total Cost Profit Revenue Cost Profit Average 7 9 10 1. 12 13 14 15 Min Max Stdev 25% Percentile 50% Percentile/Median 75% Percentile 16 12 18 1 2 3 4 s 6 7 8 9 10 12 12 13 14 15 16 17 1S Average Profit Per Policy Type Low Standard High 20 21 22 23 24 25 26 27 28 29 30 31 32 33 34 18 19 20 22 22 23 24 25 26 27 28 29 30 32 35 36 37 38 39 40 41 42 32 33 34 Model Simulation + H ell 100% On the Simulation worksheet, create a one-variable data table that will function as a predictive model by simulating 100 iterations. In cells B8:18, reference the appropriate cells on the Model worksheet. These references will be hidden, using custom formatting. Create a one- variable data table, using cell L1 as the column input cell. 2 Health Insurance Analysis mino 4 Assumption: 5 Any cost of lost profits is deducted from commission cost 6 7 Profit and Loss Probability Tables 8 Marginal Policy Cost Per Customer $ 3 9 Fixed Costs 10 Low Risk Administrative Cost $ 10,000 Claims 11 Standard Risk Administrative Cost $ 25,000 Individual Prob Cumulative Prob Claim Value or Risk 12 High Risk Administrative Cost $ 50,000 25% 0.00 Low 13 Processing Fee $ 86 60% 0.25 Standard 14 Policy Capacity $ 5,000 15% 0.85 High 15 Claim Assessment $ 6 16 Low Risk 17 Individual Prob Cumulative Prob Demand 18 Claim Value or Risk Standard 20% 0.00 700 19 Demand 2,700 35% 0.20 900 20 Risk Level 1,500 25% 0.55 1,100 21 Total Policies Underwritten 4,200 15% 0.80 1,300 22 Cancellation Vouchers Issued 0 5% 0.95 1,500 23 24 Paid Revenue $2,32,200 Standard Risk 25 Fixed Cost $ 25,000 Individual Prob Cumulative Prob Demand 26 Marginal Cost $ 12,600 5% 0.00 1,100 27 Voucher Cost $ 20% 0.05 1,500 28 Total Revenue $2,32,200 20% 0.25 1,900 29 Total Cost $ 37,600 35% 0.45 2,300 30 Profit $ 1,94,600 20% 0.80 2,700 31 32 High Risk 33 Individual Prob Cumulative Prob Demand 34 5% 0.00 1,900 35 20% 0.05 2,700 36 20% 0.25 3,500 37 35% 0.45 4,300 38 20% 0.80 5,100 Individual Individual Prob Cumulative Prob Demand 10% 0.00 900 25% 0.10 1,100 35% 0.35 1,300 20% 0.70 1,500 10% 0.90 1,700 Family Individual Prob Cumulative Prob Demand 20% 0.00 1,650 35% 2,150 25% 0.55 2,650 15% 0.80 3,150 5% 0.95 3,650 0.20 Home Insert Draw Page Layout Formulas Data Review View Tell me Share Comments X Calibri (Body) 11 A A sy Wrao Text General 3 PASTA BIU AVA === Marge & Center 3 $ % ? Insert DAIATA Format Sort Conditional Format Call Formatting as Table Styles Filter Find Select Analyze Data Al17 fx A B D H K L M N O P R s T v w X County Line Insurance Agency 2 Health Insurance Analysis Refresh setting is set for calculations coept data tables. Fit F9 to refresh the values in the simulation. If the summary data is volatile, perform more Iterations 5 G Tot Revenue Iteration Risk Total Cod Total Cost Profit Revenue Cost Profit Average 7 9 10 1. 12 13 14 15 Min Max Stdev 25% Percentile 50% Percentile/Median 75% Percentile 16 12 18 1 2 3 4 s 6 7 8 9 10 12 12 13 14 15 16 17 1S Average Profit Per Policy Type Low Standard High 20 21 22 23 24 25 26 27 28 29 30 31 32 33 34 18 19 20 22 22 23 24 25 26 27 28 29 30 32 35 36 37 38 39 40 41 42 32 33 34 Model Simulation + H ell 100% On the Simulation worksheet, create a one-variable data table that will function as a predictive model by simulating 100 iterations. In cells B8:18, reference the appropriate cells on the Model worksheet. These references will be hidden, using custom formatting. Create a one- variable data table, using cell L1 as the column input cellStep by Step Solution
There are 3 Steps involved in it
Step: 1

Get Instant Access to Expert-Tailored Solutions
See step-by-step solutions with expert insights and AI powered tools for academic success
Step: 2

Step: 3
Ace Your Homework with AI
Get the answers you need in no time with our AI-driven, step-by-step assistance
Get Started
Auditing & Assurance Services
Authors: Timothy Louwers, Penelope Bagley, Allen Blay, Jerry Strawser, Jay Thibodeau
8th Edition
978-1260703733, 1260703738