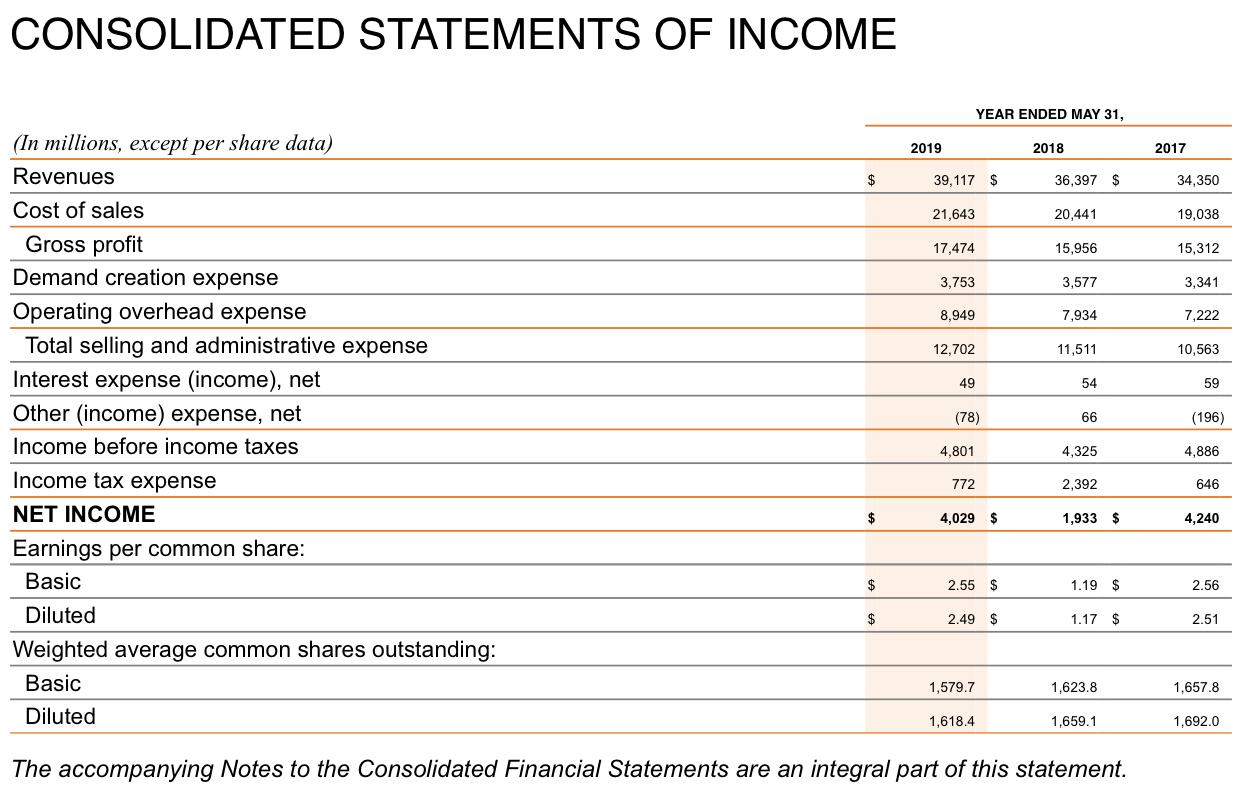
Need financial ratios and analyses - e.g., financial ratios such as ROA, ROE, payout ratio; firm performance measure such as Free Cash Flow (FCF); Beta, for Nike Inc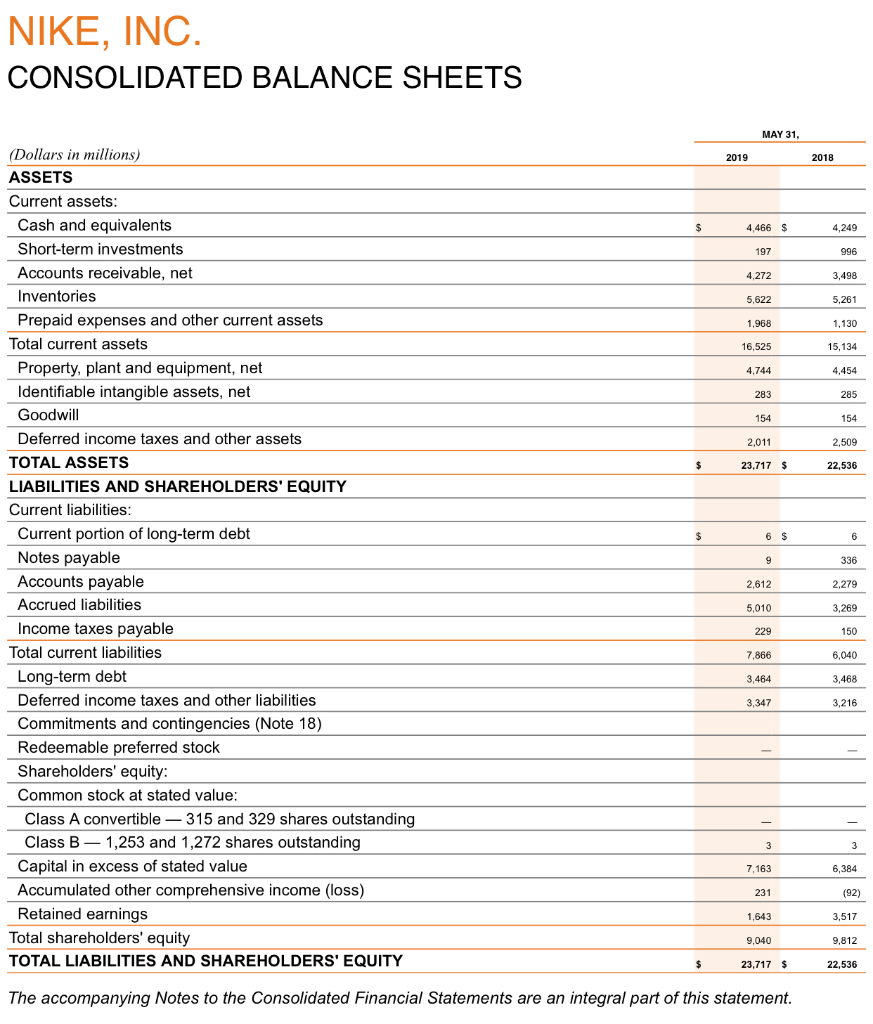
 .
.
NIKE, INC. CONSOLIDATED BALANCE SHEETS MAY 31. 2019 2018 $ 4,466 4,249 197 996 4,272 3,498 5.622 5,261 1,968 1,130 16,525 15,134 4,744 4,454 283 285 154 154 2,011 2,509 $ 23,717 $ 22,536 $ 6 $ 6 (Dollars in millions) ASSETS Current assets: Cash and equivalents Short-term investments Accounts receivable, net Inventories Prepaid expenses and other current assets Total current assets Property, plant and equipment, net Identifiable intangible assets, net Goodwill Deferred income taxes and other assets TOTAL ASSETS LIABILITIES AND SHAREHOLDERS' EQUITY Current liabilities: Current portion of long-term debt Notes payable Accounts payable Accrued liabilities Income taxes payable Total current liabilities Long-term debt Deferred income taxes and other liabilities Commitments and contingencies (Note 18) Redeemable preferred stock Shareholders' equity: Common stock at stated value: Class A convertible - 315 and 329 shares outstanding Class B - 1,253 and 1,272 shares outstanding Capital in excess of stated value Accumulated other comprehensive income (loss) Retained earnings Total shareholders' equity TOTAL LIABILITIES AND SHAREHOLDERS' EQUITY 9 336 2.612 2,279 5,010 3,269 229 150 7,866 6,040 3,464 3,468 3,347 3,216 3 3 7,163 6,384 231 (92) 1,643 3,517 9.040 9,812 $ 23,717 $ 22,536 The accompanying Notes to the Consolidated Financial Statements are an integral part of this statement. CONSOLIDATED STATEMENTS OF INCOME YEAR ENDED MAY 31, 2019 2018 2017 $ 39,117 $ 36,397 $ 34,350 21,643 20,441 19,038 17,474 15,956 15,312 3,753 3,577 3,341 8,949 7,934 7,222 12,702 11,511 10,563 49 54 59 (78) 66 (196) (In millions, except per share data) Revenues Cost of sales Gross profit Demand creation expense Operating overhead expense Total selling and administrative expense Interest expense (income), net Other (income) expense, net Income before income taxes Income tax expense NET INCOME Earnings per common share: Basic Diluted Weighted average common shares outstanding: Basic Diluted 4,801 4,325 4,886 772 2,392 646 $ 4,029 $ 1,933 $ 4,240 $ 2.55 $ 1.19 $ 2.56 $ 2.49 $ 1.17 $ 2.51 1,579.7 1,623.8 1,657.8 1,618.4 1,659.1 1,692.0 The accompanying Notes to the Consolidated Financial Statements are an integral part of this statement. NIKE, INC. CONSOLIDATED BALANCE SHEETS MAY 31. 2019 2018 $ 4,466 4,249 197 996 4,272 3,498 5.622 5,261 1,968 1,130 16,525 15,134 4,744 4,454 283 285 154 154 2,011 2,509 $ 23,717 $ 22,536 $ 6 $ 6 (Dollars in millions) ASSETS Current assets: Cash and equivalents Short-term investments Accounts receivable, net Inventories Prepaid expenses and other current assets Total current assets Property, plant and equipment, net Identifiable intangible assets, net Goodwill Deferred income taxes and other assets TOTAL ASSETS LIABILITIES AND SHAREHOLDERS' EQUITY Current liabilities: Current portion of long-term debt Notes payable Accounts payable Accrued liabilities Income taxes payable Total current liabilities Long-term debt Deferred income taxes and other liabilities Commitments and contingencies (Note 18) Redeemable preferred stock Shareholders' equity: Common stock at stated value: Class A convertible - 315 and 329 shares outstanding Class B - 1,253 and 1,272 shares outstanding Capital in excess of stated value Accumulated other comprehensive income (loss) Retained earnings Total shareholders' equity TOTAL LIABILITIES AND SHAREHOLDERS' EQUITY 9 336 2.612 2,279 5,010 3,269 229 150 7,866 6,040 3,464 3,468 3,347 3,216 3 3 7,163 6,384 231 (92) 1,643 3,517 9.040 9,812 $ 23,717 $ 22,536 The accompanying Notes to the Consolidated Financial Statements are an integral part of this statement. CONSOLIDATED STATEMENTS OF INCOME YEAR ENDED MAY 31, 2019 2018 2017 $ 39,117 $ 36,397 $ 34,350 21,643 20,441 19,038 17,474 15,956 15,312 3,753 3,577 3,341 8,949 7,934 7,222 12,702 11,511 10,563 49 54 59 (78) 66 (196) (In millions, except per share data) Revenues Cost of sales Gross profit Demand creation expense Operating overhead expense Total selling and administrative expense Interest expense (income), net Other (income) expense, net Income before income taxes Income tax expense NET INCOME Earnings per common share: Basic Diluted Weighted average common shares outstanding: Basic Diluted 4,801 4,325 4,886 772 2,392 646 $ 4,029 $ 1,933 $ 4,240 $ 2.55 $ 1.19 $ 2.56 $ 2.49 $ 1.17 $ 2.51 1,579.7 1,623.8 1,657.8 1,618.4 1,659.1 1,692.0 The accompanying Notes to the Consolidated Financial Statements are an integral part of this statement


