need formulas
need formulas
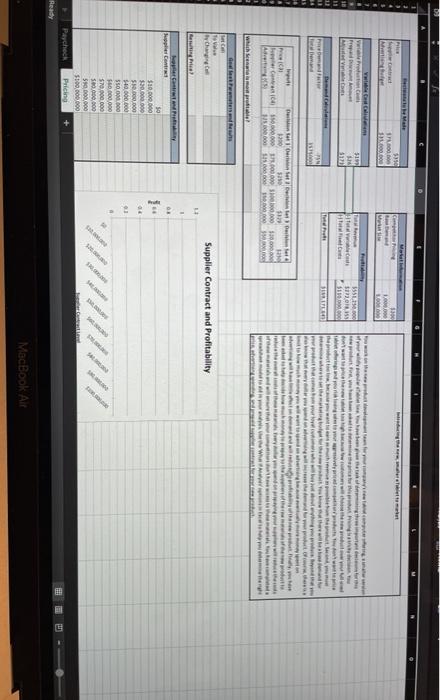
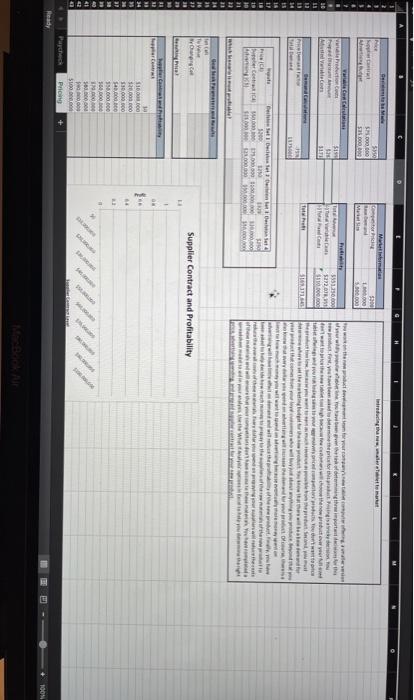
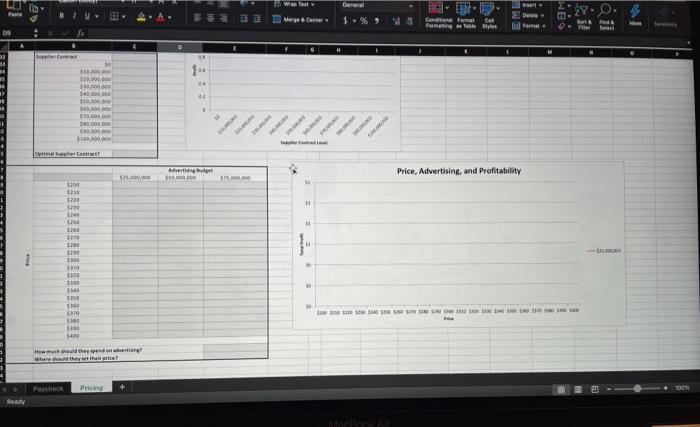
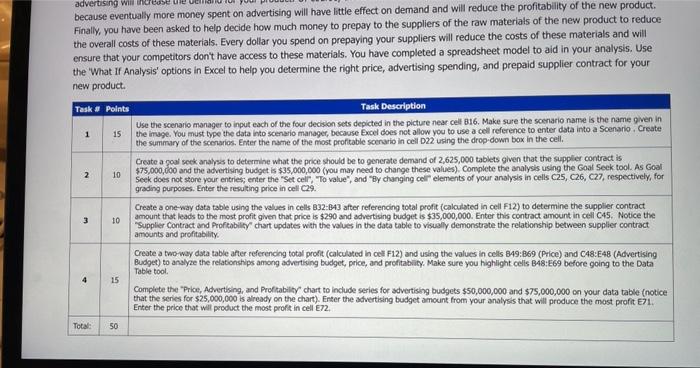
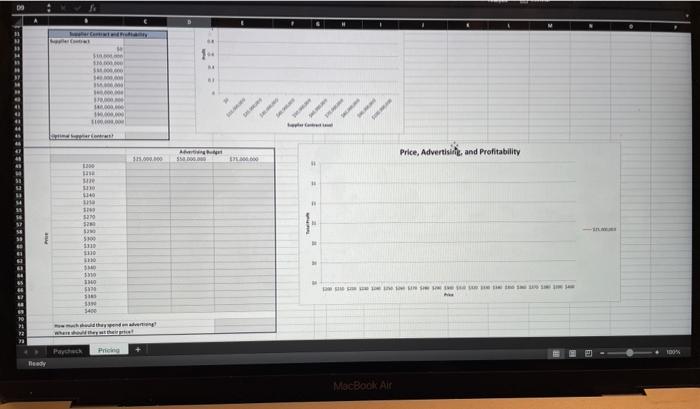
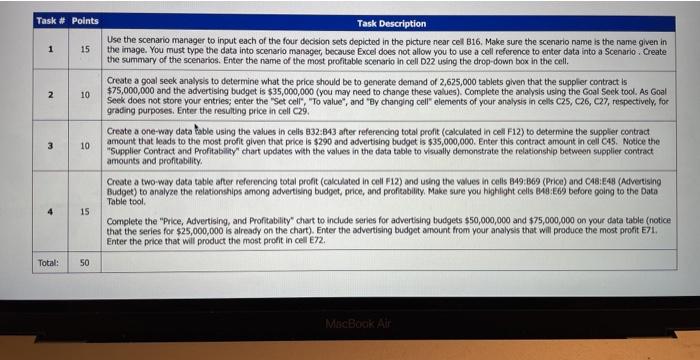
H DEM NE Marmi Contoh Twith 5900 100 50 000 Wideo | 5158 TA mwyor. www.gimport Im lau ra, v ai ai ang qua li trong thi vi y khi giao Ping Hy da vi vu wwwwwwwww yor www.doc 39316 5272 0.000 3171 www www her PIC ple De besloten 5300 12 1.000.000,00 S. warence Supplier Contract and Profitability $10.000000 $20.000 10.000.000 520,000 550.000.000 500,000.00 1.000 So. SLO DO Pricing Paycheck Ready 100N Werl F333 De Merye A Carta Coralite Formelle CHI OOM VI perC $10.00 5.000 000 000 01 900 000 000 000 100 000 Ang Price, Advertising and Profitability SI5.000 1.000.000 00! 13 200 3279 1 DONE 11 Ees 50 SHO SO SO Hits 05 BONS How the Paycheck Pricing DON Ready More advertising will these uie el because eventually more money spent on advertising will have little effect on demand and will reduce the profitability of the new product. Finally, you have been asked to help decide how much money to prepay to the suppliers of the raw materials of the new product to reduce the overall costs of these materials. Every dollar you spend on prepaying your suppliers will reduce the costs of these materials and will ensure that your competitors don't have access to these materials. You have completed a spreadsheet model to aid in your analysis. Use the 'What If Analysis' options in Excel to help you determine the right price, advertising spending, and prepaid supplier contract for your new product. Task Points Task Description Use the scenario manager to input each of the four decision sets depicted in the picture near cell B16. Make sure the scenario name is the name given in 1 15 the image. You must type the data into scenario manager, because Excel does not allow you to use a cell reference to enter data into a Scenario. Create the summary of the scenarios. Enter the name of the most profitable scenario in cell D22 using the drop down box in the cell. Create a goal seek analysis to determine what the price should be to generate demand of 2,625,000 tablets given that the supplier contract is $75,000,doo and the advertising budget is $35,000,000 (you may need to change these values). Complete the analysis using the Goal Seek tool. As Goal Seek does not store your entries, enter the "Set cell "To value", and "By changing cell elements of your analysis in cells c2s, C26, C27, respectively, for grading purposes. Enter the resulting price in cell C29. 2 10 3 10 Create a one-way data table using the values in cells B32:043 after referencing total profit (calculated in cell F12) to determine the supplier contract amount that leads to the most profit given that price is $290 and advertising budget is $35,000,000. Enter this contract amount in cell C45. Notice the "Supplier Contract and Profitability chart updates with the values in the data table to visually demonstrate the relationship between supplier contract amounts and profitability Create a two-way data table after referencing total profit (calculated in cel F12) and using the values in cells 849:B69 (Price) and C48:E48 (Advertising Budget) to analyze the relationships among advertising budget, price, and profitability. Make sure you highlight cells B48:E69 before going to the Data Table tool Complete the "Price Advertising, and profitability chart to Indude series for advertising budgets $50,000,000 and $75,000,000 on your data table (notice that the series for $25,000,000 is already on the chart). Enter the advertising budget amount from your analysis that will produce the most profit E71 Enter the price that will product the most profit in cell E72. 4 15 Total: 50 5310 1300 .. WW 11 000 MOS M TH www wwwww own to www www. wwwww www.motor wwwww STRA Dobre MICH 120 $250 Ch 10.000.000 1.000.000.000 $20.000.000 AS 000000 wwwwwwwwwwwwwwww Wh which Towe Change Supplier Contract and Profitability Cat applicant 05 04 $10.000.000 $20.000.000 S000.000 $40.000.000 550.000000 F.000.000 $70,000.00 500.000.000 50.000.000 $100,000,000 Pricing . SA Paycheck Reach MacBook Air B WE Price, Advertise and Profitability . OTS 11 CS 1 IN 57 - 05 TES GUTS M 3310 SIS NE 540 with Pard 100K Teedy MacBook Air Task # Points 1 15 2 10 Task Description Use the scenario manager to input each of the four decision sets depicted in the picture near cell B16. Make sure the scenario name is the name given in the image. You must type the data into scenario manager, because Excel does not allow you to use a cell reference to enter data into a Scenario . Create the summary of the scenarios. Enter the name of the most profitable scenario in cell D22 using the drop-down box in the cell. Create a goal seek analysis to determine what the price should be to generate demand of 2,625,000 tablets given that the suppler contract is $75,000,000 and the advertising budget is $35,000,000 (you may need to change these values). Complete the analysis using the Goal Seek tool. As Goal Seek does not store your entries, enter the "Set cell", "To value", and "By changing cell" elements of your analysis in cells c2s, C25, C27, respectively, foe grading purposes. Enter the resulting price in cell C29. Create a one-way data table using the values in cells 832:843 after referencing total profit (calculated in cell F12) to determine the suppler contract amount that leads to the most profit given that price is $290 and advertising budget is $35,000,000. Enter this contract amount in cell C45. Notice the "Supplier Contract and profitability" chart updates with the values in the data table to visually demonstrate the relationship between supplier contract amounts and profitability Create a two-way dotatable after referencing total profit (calculated in coll F12) and using the values in cells 849:369 (Price) and 48:E48 (Advertising Budget) to analyze the relationships among advertising budpet, price, and profitability. Make sure you highlight cells 848:E69 before going to the Dota Table tool Complete the "Price, Advertising, and Profitability" chart to include series for advertising budgets $50,000,000 and $75,000,000 on your data table (notice that the series for $25,000,000 is already on the chart). Enter the advertising budget amount from your analysis that will produce the most profit E71. Enter the price that will product the most profit in cell E72. 3 10 15 Total: 50 MacBook Air H DEM NE Marmi Contoh Twith 5900 100 50 000 Wideo | 5158 TA mwyor. www.gimport Im lau ra, v ai ai ang qua li trong thi vi y khi giao Ping Hy da vi vu wwwwwwwww yor www.doc 39316 5272 0.000 3171 www www her PIC ple De besloten 5300 12 1.000.000,00 S. warence Supplier Contract and Profitability $10.000000 $20.000 10.000.000 520,000 550.000.000 500,000.00 1.000 So. SLO DO Pricing Paycheck Ready 100N Werl F333 De Merye A Carta Coralite Formelle CHI OOM VI perC $10.00 5.000 000 000 01 900 000 000 000 100 000 Ang Price, Advertising and Profitability SI5.000 1.000.000 00! 13 200 3279 1 DONE 11 Ees 50 SHO SO SO Hits 05 BONS How the Paycheck Pricing DON Ready More advertising will these uie el because eventually more money spent on advertising will have little effect on demand and will reduce the profitability of the new product. Finally, you have been asked to help decide how much money to prepay to the suppliers of the raw materials of the new product to reduce the overall costs of these materials. Every dollar you spend on prepaying your suppliers will reduce the costs of these materials and will ensure that your competitors don't have access to these materials. You have completed a spreadsheet model to aid in your analysis. Use the 'What If Analysis' options in Excel to help you determine the right price, advertising spending, and prepaid supplier contract for your new product. Task Points Task Description Use the scenario manager to input each of the four decision sets depicted in the picture near cell B16. Make sure the scenario name is the name given in 1 15 the image. You must type the data into scenario manager, because Excel does not allow you to use a cell reference to enter data into a Scenario. Create the summary of the scenarios. Enter the name of the most profitable scenario in cell D22 using the drop down box in the cell. Create a goal seek analysis to determine what the price should be to generate demand of 2,625,000 tablets given that the supplier contract is $75,000,doo and the advertising budget is $35,000,000 (you may need to change these values). Complete the analysis using the Goal Seek tool. As Goal Seek does not store your entries, enter the "Set cell "To value", and "By changing cell elements of your analysis in cells c2s, C26, C27, respectively, for grading purposes. Enter the resulting price in cell C29. 2 10 3 10 Create a one-way data table using the values in cells B32:043 after referencing total profit (calculated in cell F12) to determine the supplier contract amount that leads to the most profit given that price is $290 and advertising budget is $35,000,000. Enter this contract amount in cell C45. Notice the "Supplier Contract and Profitability chart updates with the values in the data table to visually demonstrate the relationship between supplier contract amounts and profitability Create a two-way data table after referencing total profit (calculated in cel F12) and using the values in cells 849:B69 (Price) and C48:E48 (Advertising Budget) to analyze the relationships among advertising budget, price, and profitability. Make sure you highlight cells B48:E69 before going to the Data Table tool Complete the "Price Advertising, and profitability chart to Indude series for advertising budgets $50,000,000 and $75,000,000 on your data table (notice that the series for $25,000,000 is already on the chart). Enter the advertising budget amount from your analysis that will produce the most profit E71 Enter the price that will product the most profit in cell E72. 4 15 Total: 50 5310 1300 .. WW 11 000 MOS M TH www wwwww own to www www. wwwww www.motor wwwww STRA Dobre MICH 120 $250 Ch 10.000.000 1.000.000.000 $20.000.000 AS 000000 wwwwwwwwwwwwwwww Wh which Towe Change Supplier Contract and Profitability Cat applicant 05 04 $10.000.000 $20.000.000 S000.000 $40.000.000 550.000000 F.000.000 $70,000.00 500.000.000 50.000.000 $100,000,000 Pricing . SA Paycheck Reach MacBook Air B WE Price, Advertise and Profitability . OTS 11 CS 1 IN 57 - 05 TES GUTS M 3310 SIS NE 540 with Pard 100K Teedy MacBook Air Task # Points 1 15 2 10 Task Description Use the scenario manager to input each of the four decision sets depicted in the picture near cell B16. Make sure the scenario name is the name given in the image. You must type the data into scenario manager, because Excel does not allow you to use a cell reference to enter data into a Scenario . Create the summary of the scenarios. Enter the name of the most profitable scenario in cell D22 using the drop-down box in the cell. Create a goal seek analysis to determine what the price should be to generate demand of 2,625,000 tablets given that the suppler contract is $75,000,000 and the advertising budget is $35,000,000 (you may need to change these values). Complete the analysis using the Goal Seek tool. As Goal Seek does not store your entries, enter the "Set cell", "To value", and "By changing cell" elements of your analysis in cells c2s, C25, C27, respectively, foe grading purposes. Enter the resulting price in cell C29. Create a one-way data table using the values in cells 832:843 after referencing total profit (calculated in cell F12) to determine the suppler contract amount that leads to the most profit given that price is $290 and advertising budget is $35,000,000. Enter this contract amount in cell C45. Notice the "Supplier Contract and profitability" chart updates with the values in the data table to visually demonstrate the relationship between supplier contract amounts and profitability Create a two-way dotatable after referencing total profit (calculated in coll F12) and using the values in cells 849:369 (Price) and 48:E48 (Advertising Budget) to analyze the relationships among advertising budpet, price, and profitability. Make sure you highlight cells 848:E69 before going to the Dota Table tool Complete the "Price, Advertising, and Profitability" chart to include series for advertising budgets $50,000,000 and $75,000,000 on your data table (notice that the series for $25,000,000 is already on the chart). Enter the advertising budget amount from your analysis that will produce the most profit E71. Enter the price that will product the most profit in cell E72. 3 10 15 Total: 50 MacBook Air