Need help
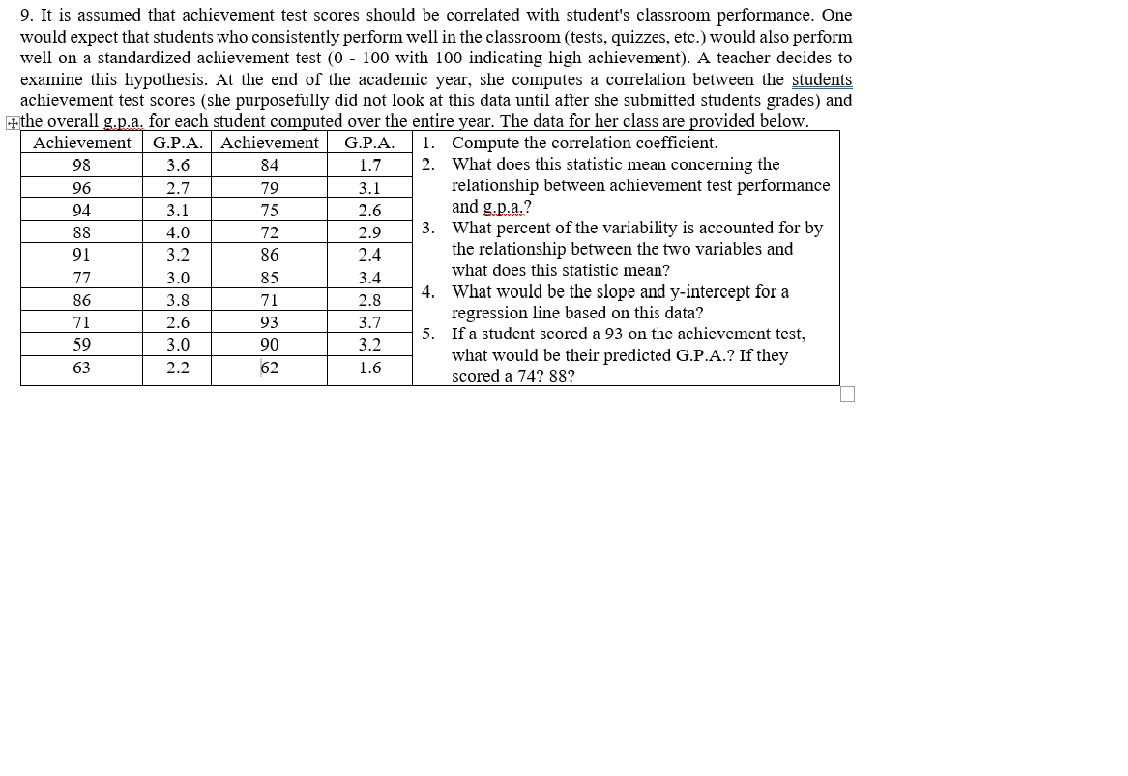
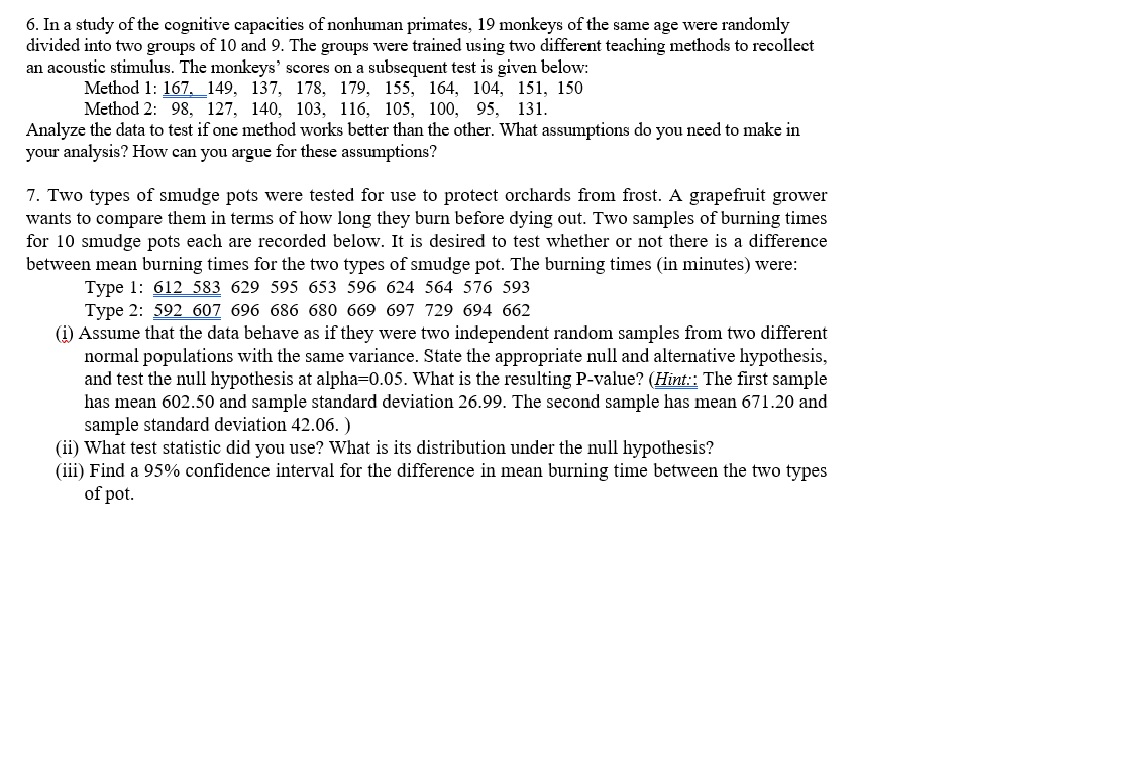
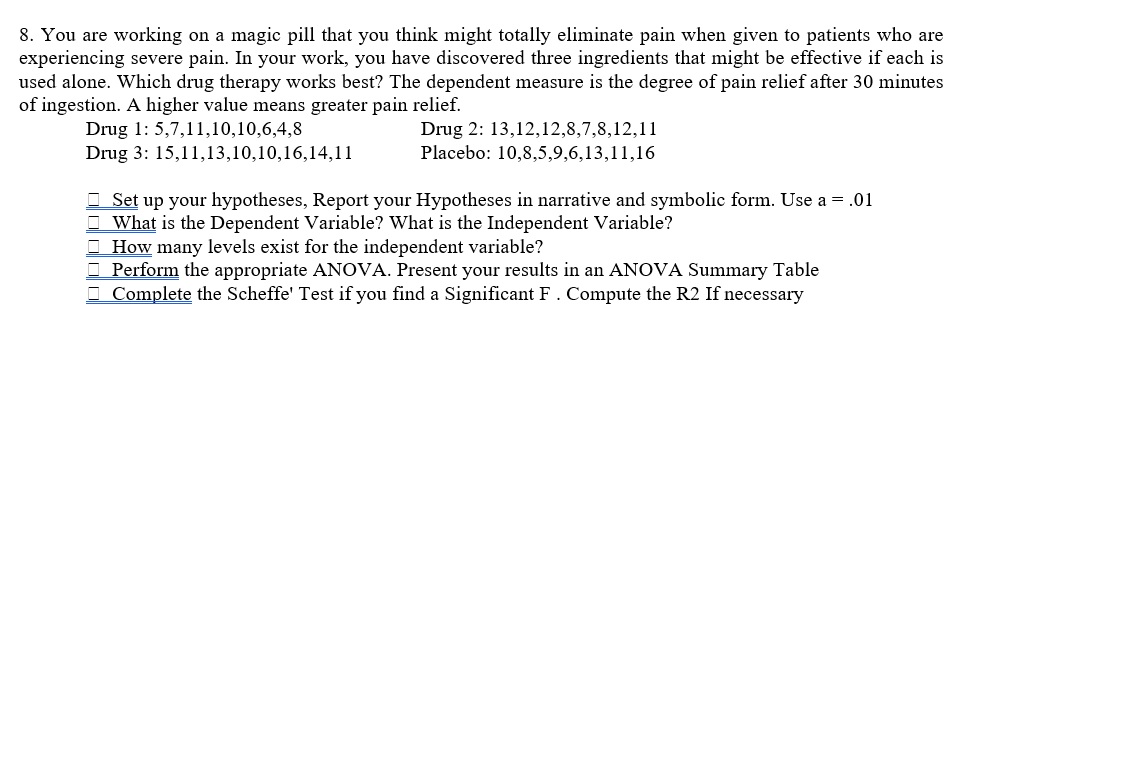
9. It is assumed that achievement test scores should be correlated with student's classroom performance. One would expect that students who comistentl).r perform well in the classroom (tests, quizzes, etc.) would also perform well on a standardized achievement test (0 100 with 100 indicating high achievement). A teacher decides to examine this hypothesis. At the end of the academic year, she computes a correlaLion between the students achievement test scores (she purposefully did not look at this data until after she submitted students grades) and e overall . .a. for each student computed over the entire year. The data for her class are provided below. Achievement G.P.A. Achievement G.P.A. 1. Compute the correlation coefcient. 98 3.6 84 1.7 2. What does this statistic mean concerning the 96 23' 79 3_1 relationship between achievement test performance 94 3.1 75 2.5 and heat? 33 4_0 72 19 3. What percent of the variability is accounted for by 91 32 86 2.4 the relationship between the two variables and 77 10 85 14 what does this statistic meal? 86 3.8 71 2.3 4. What would be the slope and yintercept for a 71 2_ 93 3-? regression line based on this data? UI If a student scored a 93 on the achievement test, what would be their predicted G.P.A.? Ifthey scored a 74'? 88'? 59 3 .0 90 3.2 63 2.2 62 1.6 6. In a study of the cognitive capacities of nonhunlan primates, 19 monkeys of the same age were randomly divided into two groups of 10 and 9. The groups were trained using two different teaching methods to recollect an acoustic stimulus. The monkeys' scores on a subsequent test is given below: Method 1: 167= 149, 137, 178, 179, 155, 164, 104, 151, 150 Method 2: 98, 127, 14-0, 103, 116, 105, 100, 95, 131. Analyze the data in test if one method wodrs better than the other. What assumptions do you need to make in your analysis? How can you argue for these assumptions? 7. Two types of smudge pots were tested for use to protect orchards om frost. A grapefruit grower wants to compare them in terms of how long they burn before dying out. Two samples of burning times for 10 smudge pots each are recorded below. It is desired to test whether or not there is a dierence between mean burning times for the two types of smudge pot. The burning times (in minutes) were: Type 1: 612 583 629 595 653 596 624 564 576 593 Type 2: 592 607 696 686 680 669' 697Ir 729 694 662 (1) Assume that the data behave as if they were two independent random samples from two di'erent normal populations with the same variance. State the appropriate null and altemative hypothesis, and test the null hypothesis at alpha=0.05. What is the resulting P-valne? (m The first sample has mean 602.50 and sample standard deviation 26.99. The second sample has mean 671.20 and sample standard deviation 42.06. ) (ii) What test statistic did you use? What is its distribution under the null hypothesis? (iii) Find a 95% confidence interval for the difference in mean burning time between the two types of pot. 8. You are working on a magic pill that you think might totally eliminate pain when given to patients who are experiencing severe pain. In your work, you have discovered three ingredients that might be effective if each is used alone. Which drug therapy works best? The dependent measure is the degree of pain relief after 30 minutes of ingestion. A higher value means greater pain relief. Drug l: 5,7,11,10,10,6,4,8 Drug 2: 13,12,12,8,7,8,12,11 Drug 3: 15,11,13,10,10,l6,14,ll Placebo: 10,8,5,9,6,l3,l 1,16 7 Set up your hypotheses, Report your Hypotheses in narrative and symbolic form. Use a = .01 What is the Dependent Variable? What is the Independent Variable? How many levels exist for the independent variable? Perform the appropriate ANOVA. Present your results in an AN OVA Summary Table Complete the Schee' Test if you nd a Signicant F . Compute the R2 If necessary