

Question: Need help:-- A cork intended for use in a wine bottle is considered acceptable if its diameter is between 2.9 cm and 3.1 cm (so
Need help:--
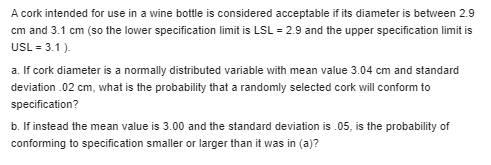
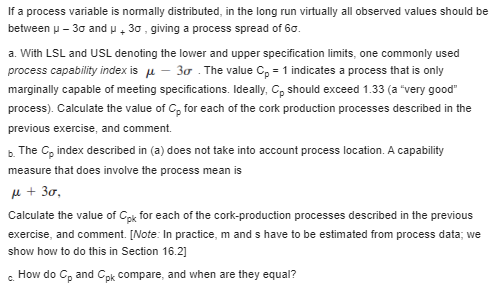
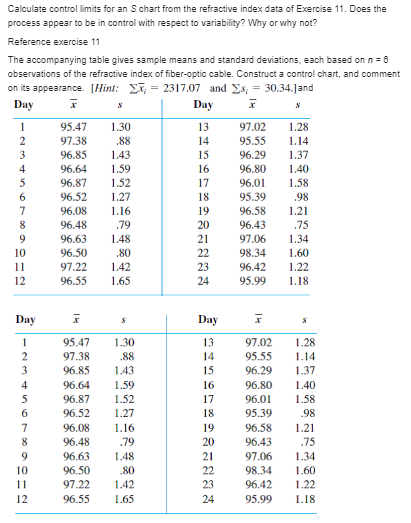
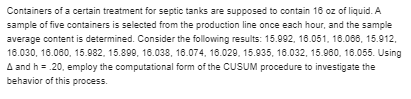
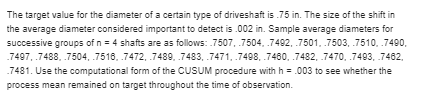
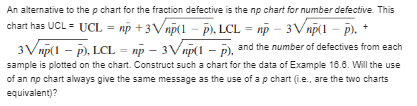
A cork intended for use in a wine bottle is considered acceptable if its diameter is between 2.9 cm and 3.1 cm (so the lower specification limit is LSL = 2.9 and the upper specification limit is USL = 3.1 ). a. If cork diameter is a normally distributed variable with mean value 3.04 cm and standard deviation .02 cm, what is the probability that a randomly selected cork will conform to specification? b. If instead the mean value is 3.00 and the standard deviation is .05, is the probability of conforming to specification smaller or larger than it was in (a)?If a process variable is normally distributed, in the long run virtually all observed values should be between u - 30 and u + 30 , giving a process spread of 60. a. With LSL and USL denoting the lower and upper specification limits, one commonly used process capability index is u - 30 . The value Co = 1 indicates a process that is only marginally capable of meeting specifications. Ideally, C. should exceed 1.33 (a "very good" process). Calculate the value of C, for each of the cork production processes described in the previous exercise, and comment. b. The Co index described in (a) does not take into account process location. A capability measure that does involve the process mean is M + 30. Calculate the value of Cox for each of the cork-production processes described in the previous exercise, and comment. [Vote: In practice, m and s have to be estimated from process data; we show how to do this in Section 16.2] c. How do Go and Gok compare, and when are they equal?Calculate control limits for an $ chart from the refractive index data of Exercise 11. Does the process appear to be in control with respect to variability? Why or why not? Reference exercise 11 The accompanying table gives sample means and standard deviations, each based on n = 6 observations of the refractive index of fiber-optic cable. Construct a control chart, and comment on its appearance. [Mine, Ex, = 2317.07 and Ss; = 30.34.]and Day Day 95.47 1.30 13 97.02 1.28 97.38 88 14 95.55 1.14 96.85 1.43 15 96.29 1.37 NOUAWNE 96.64 1.59 16 96.80 1.40 96.87 1.52 17 96.01 1.58 96.52 1.27 18 95.39 .98 96.08 1.16 19 96.58 1.21 96.48 .79 20 96.43 .75 96.63 1.48 21 97.06 1.34 10 96.50 .80 22 98.34 1.60 11 97.22 1.42 23 96.42 1.22 12 96.55 1.65 24 95.99 1.18 Day Day 95.47 1.30 13 97.02 1.28 97.38 .88 14 95.55 1.14 96.85 1.43 15 96.29 1.37 96.64 1.59 16 96.80 1.40 96.87 1.52 17 96.01 1.58 96.52 1.27 18 95.39 98 96.08 1.16 19 96.58 1.21 96.48 .79 20 96.43 .75 96.63 1.48 21 97.06 1.34 10 96.50 .80 22 98.34 1.60 11 97.22 1.42 23 96.42 1.22 12 96.55 1.65 24 95.99 1.18\fContainers of a certain treatment for septic tanks are supposed to contain 16 oz of liquid. A sample of five containers is selected from the production line once each hour, and the sample average content is determined. Consider the following results: 15.992, 16.051, 16.065, 15.912, 18.030, 18.080, 15.982. 15.890, 18.038, 16.074, 16.029. 15.935, 18.032, 15.960, 16.055. Using A and h = .20, employ the computational form of the CUSUM procedure to investigate the behavior of this process.The target value for the diameter of a certain type of driveshaft is .75 in. The size of the shift in the average diameter considered important to detect is .002 in. Sample average diameters for successive groups of n = 4 shafts are as follows: .7507, .7504. .7492. .7501. .7503, .7510. .7490. 7497. . 7488. .7504. .7516. 7472. .7489. .7483, .7471. .7498. .7460, .7482, 7470. . 7493. .7482. 7481. Use the computational form of the CUSUM procedure with h = .003 to see whether the process mean remained on target throughout the time of observation.\fAn alternative to the p chart for the fraction defective is the no chart for number defective This chart has UCL = UCL = ap + 3Vap(1 - p). LCL = ap - 3Vap(1 - p) + 3V mp(1 - p). LCL = mp - 3 V mp(1 - p), and the number of defectives from each sample is plotted on the chart. Construct such a chart for the data of Example 18.8. Will the use of an no chart always give the same message as the use of a p chart (Le., are the two charts equivalent)?\f
Step by Step Solution
There are 3 Steps involved in it

Get step-by-step solutions from verified subject matter experts