 Need help answering the tables that shows 0 and also by looking at the spreadsheets.
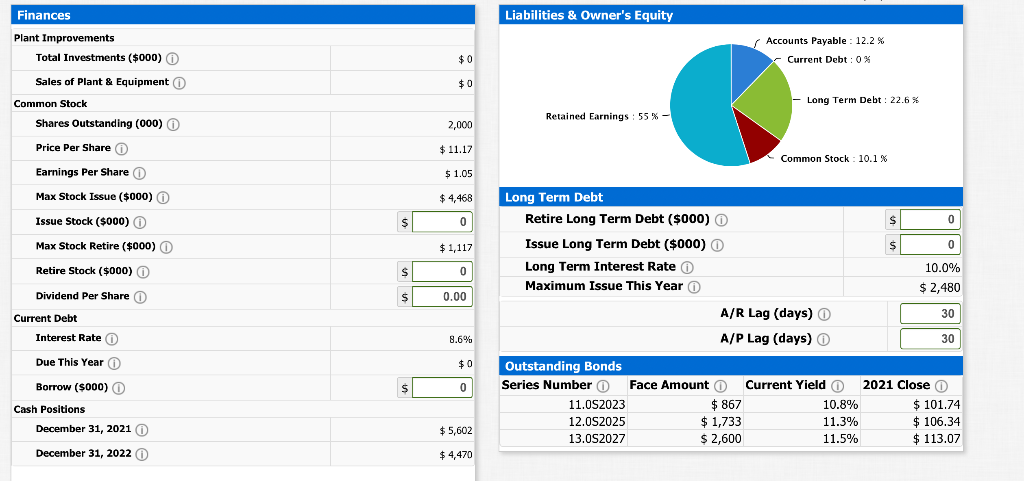
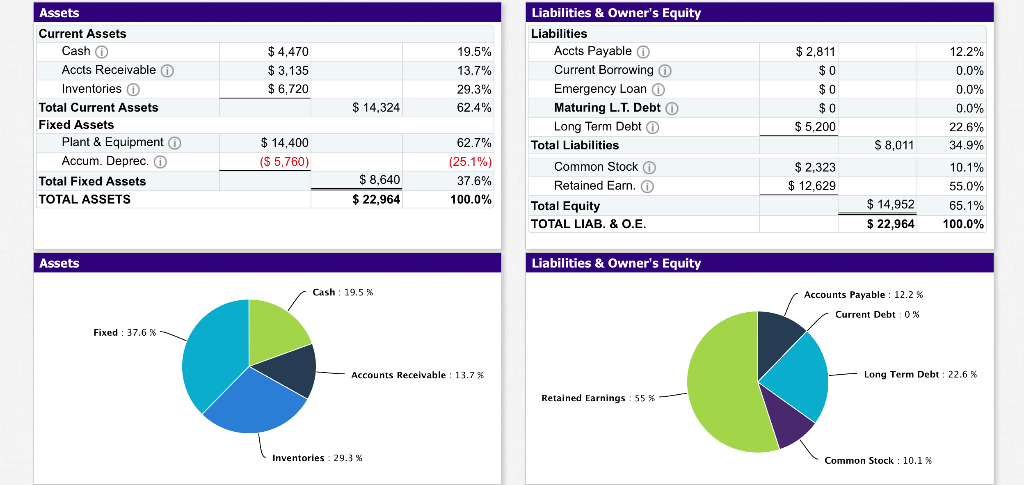
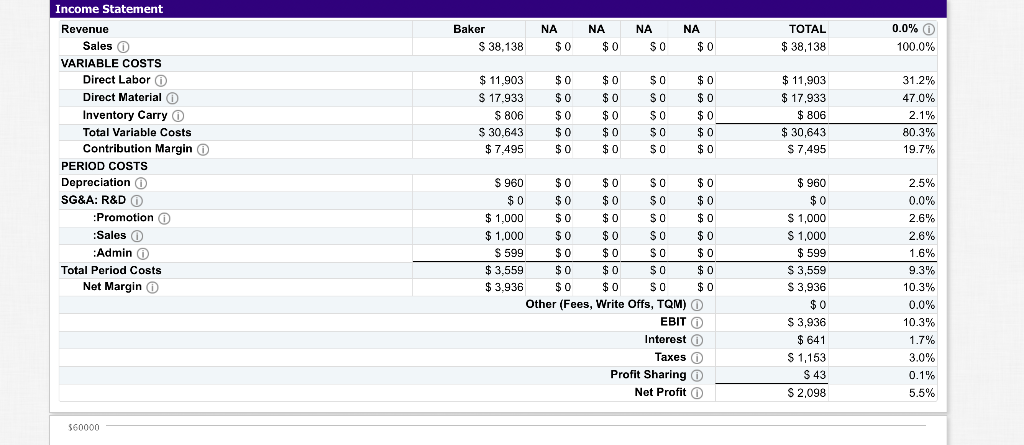
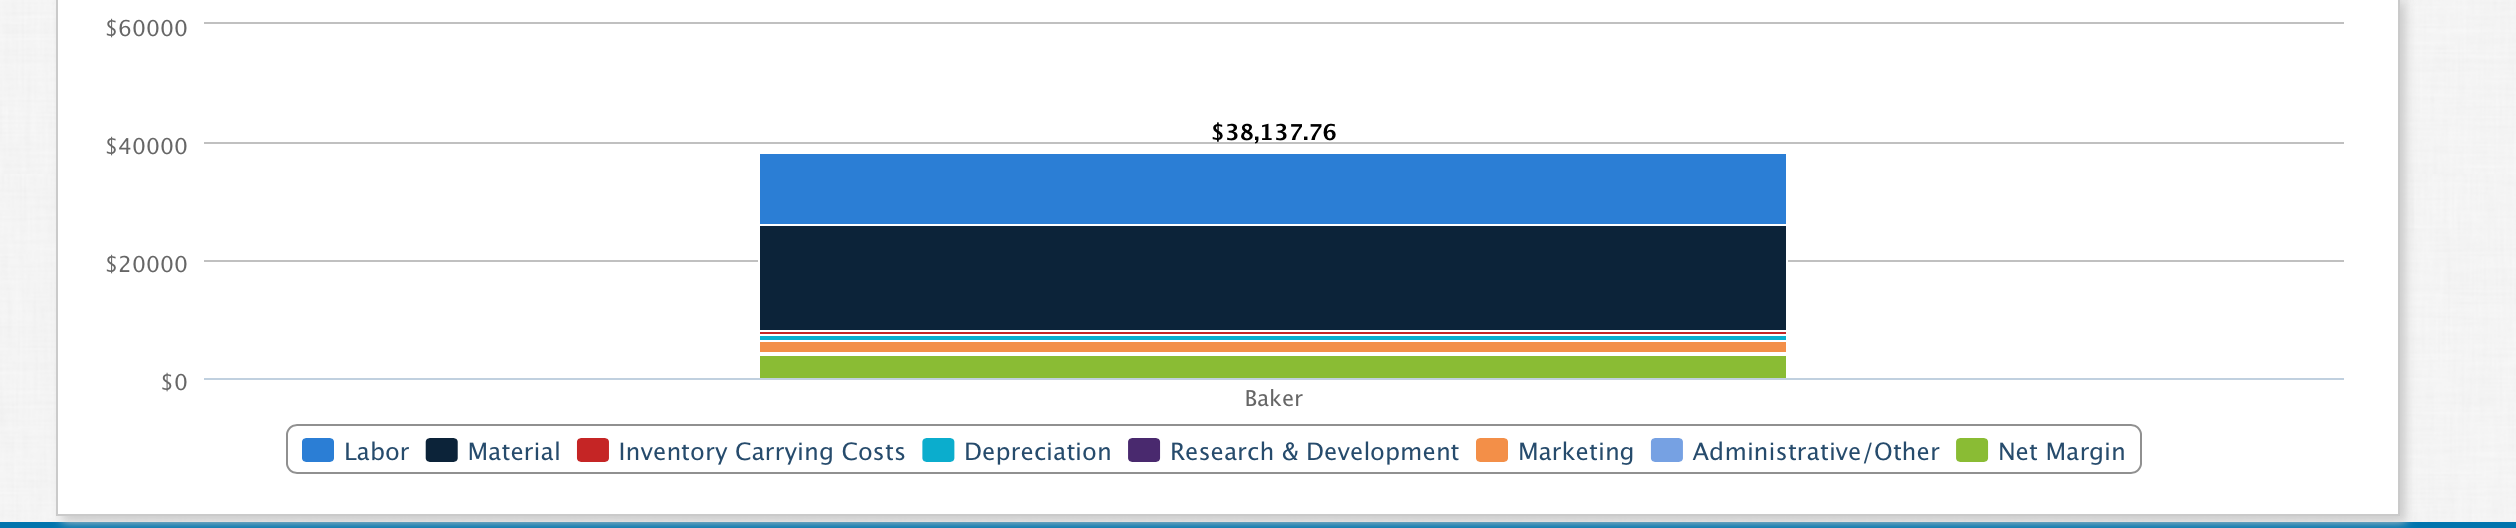
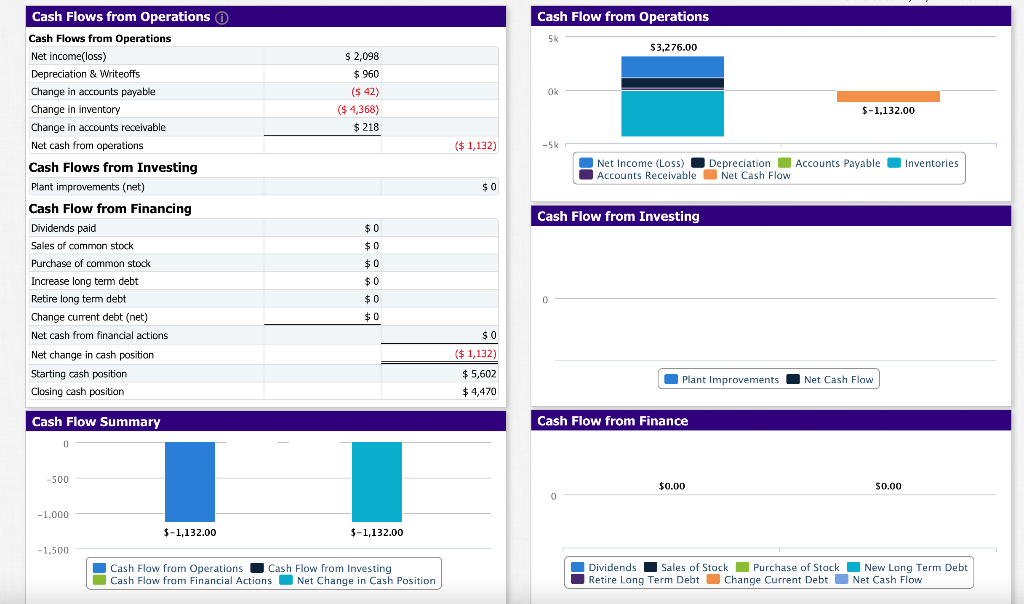
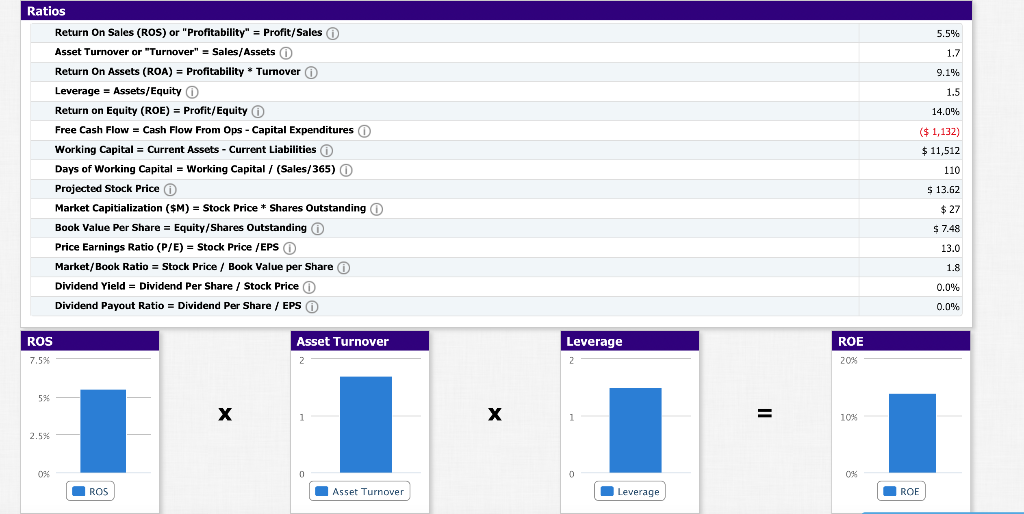
$ 4,470 $ 3,135 $ 6,720 Assets Current Assets Cash 0 Accts Receivable Inventories o Total Current Assets Fixed Assets Plant & Equipment Accum. Deprec. O Total Fixed Assets TOTAL ASSETS 19.5% 13.7% 29.3% 62.4% Liabilities & Owner's Equity Liabilities Accts Payable o Current Borrowing Emergency Loan Maturing L.T. Debt Long Term Debt Total Liabilities Common Stock Retained Earn. Total Equity TOTAL LIAB. & O.E. $ 2,811 $0 $0 $0 $ 5,200 $ 14,324 $ 14,400 ($ 5,760) 12.2% 0.0% 0.0% 0.0% 22.6% 34.9% 10.1% 55.0% 65.1% 100.0% 62.7% (25.1%) 37.6% 100.0% $ 8,011 $ 8,640 $ 2,323 $ 12.629 $ 22,964 $ 14,952 $ 22,964 Assets Liabilities & Owner's Equity Cash: 19.5% Accounts Payable : 12.2 % Current Debt: 0% Fixed : 37.6 % Accounts Receivable: 13.7% Long Term Debt: 22.6 % Retained Earnings : 55% Inventories: 29.3% Common Stock : 10.1% NA Baker $ 38,138 NA $0 NA $0 NA SO TOTAL $ 38,138 0.0% 0 100.0% $ 0 SO Income Statement Revenue Sales o VARIABLE COSTS Direct Labor O Direct Material Inventory Carry O Total Variable Costs Contribution Margin PERIOD COSTS Depreciation SG&A: R&D O :Promotion Sales o : Admin Total Period Costs Net Margin 0 $ 11,903 S 17.933 $ 806 $ 30,643 $ 7,495 $0 $0 $0 $0 $0 $0 $0 $0 $ 0 $ 0 SO SO $0 SO $0 $ 0 $ 0 $ 0 $ 0 $ 11,903 $ 17,933 $ 806 $ 30,643 S 7,495 31.2% 47.0% 2.1% 80.3% 19.7% $ 960 $0 $0 SO $0 $0 $0 $ 0 SO $ 0 $ 1,000 $0 $0 SO $ 0 $ 1.000 $0 $ 0 SO $ 0 $ 599 $0 $0 SO $ 0 $ 3,559 $0 $0 So $ 0 $ 3.936 $0 $ 0 SO $ 0 Other (Fees, Write Offs, TQM) EBITO Interest Taxes Profit Sharing Net Profit $ 960 $0 S 1,000 S 1,000 $ 599 S 3,559 S 3,936 $ 0 $ 3,936 $ 641 $ 1,153 S43 S 2,098 2.5% 0.0% 2.6% 2.6% 1.6% 9.3% 10.3% 0.0% 10.3% 1.7% 3.0% 0.1% 5.5% 560000 $60000 $38,137.76 $40000 $20000 $0 Baker Labor Material Inventory Carrying Costs Depreciation Research & Development Marketing Administrative/Other Net Margin Cash Flow from Operations 5k $3,276.00 $ 2,098 OK $ 960 ($ 42) ($ 4,368) $ 218 $-1,132.00 ($ 1,132) -5k Net Income (Loss) Depreciation Accounts Payable Accounts Receivable Net Cash Flow Inventories $0 Cash Flows from Operations Cash Flows from Operations Net income(loss) Depreciation & Writeoffs Change in accounts payable Change in inventory Change in accounts receivable Net cash from operations Cash Flows from Investing Plant improvements (net) Cash Flow from Financing Dividends paid Sales of common stock Purchase of common stock Increase long term debt Retire long term debt Change current debt (net) Net cash from financial actions Net change in cash position Starting cash position Closing cash position Cash Flow from Investing $0 $0 $0 $0 $0 0 $0 SO ($ 1,132) $ 5,602 $ 4,470 Plant Improvements Net Cash Flow Cash Flow Summary Cash Flow from Finance 0 -500 $0.00 $0.00 0 -1,000 $-1,132.00 $-1,132.00 -1,500 Cash Flow from Operations Cash Flow from Investing Cash Flow from Financial Actions Net Change in Cash Position Dividends Sales of Stock Purchase of Stack New Long Term Debt Retire Long Term Debt Change Current Debt Net Cash Flow 5.5% 1.7 9.1% 1.5 14.0% ($ 1,132) Ratios Return On Sales (ROS) or "Profitability" = Profit/Sales Asset Turnover or "Turnover" = Sales/Assets Return On Assets (ROA) = Profitability * Turnover Leverage = Assets/Equity Return on Equity (ROE) = Profit/Equity Free Cash Flow - Cash Flow From Ops - Capital Expenditures Working Capital = Current Assets - Current Liabilities Days of Working Capital = Working Capital / (Sales/365) O Projected Stock Price Market Capitialization ($M) - Stock Price * Shares Outstanding Book Value Per Share = Equity/Shares Outstanding Price Earnings Ratio (P/E) - Stock Price /EPSO () Market/Book Ratio = Stock Price / Book Value per Share o Dividend Yield = Dividend Per Share / Stock Price O Dividend Payout Ratio = Dividend Per Share / EPSO $ 11,512 110 5 13.62 $ 27 $ 7.48 13.0 1.8 0.0% 0.0% Asset Turnover ROS 7.5% % Leverage 2 ROE 20% 594 1 = 1 10% 2.5% 096 0 0 0% ROS Asset Turnover Leverage ROE Liabilities & Owner's Equity Finances Plant Improvements Total Investments ($000) O Accounts Payable : 12.2 % Current Debt: 0% $0 Sales of Plant & Equipment $0 Long Term Debt: 22.6 % Common Stock Shares Outstanding (000) O Retained Earnings : 55 % - %- 2,000 Price Per Share o $11.17 Common Stock: 10.1% Earnings Per Share o $ 1.05 $ 4,466 Max Stock Issue ($000) Issue Stock ($000) O () Max Stock Retire ($000) O $ 0 $ 1,117 Retire Stock ($000) S 0 Dividend Per Share o $ 0.00 Current Debt Interest Rate O Long Term Debt Retire Long Term Debt ($000) O S 0 Issue Long Term Debt ($000) O $ 0 Long Term Interest Rate 10.0% Maximum Issue This Year O $ 2,480 A/R Lag (days) 30 A/P Lag (days) 30 Outstanding Bonds Series Number Face Amount Current Yield 2021 Close 11.0S2023 $ 867 10.8% $ 101.74 12.0S2025 $ 1,733 11.3% $ 106.34 13.0S2027 $ 2,600 11.5% $ 113.07 8.6% $0 $ 0 Due This Year Borrow ($000) Cash Positions December 31, 2021 0 $ 5,602 December 31, 2022 $ 4,470