Need help answering these practice problems.
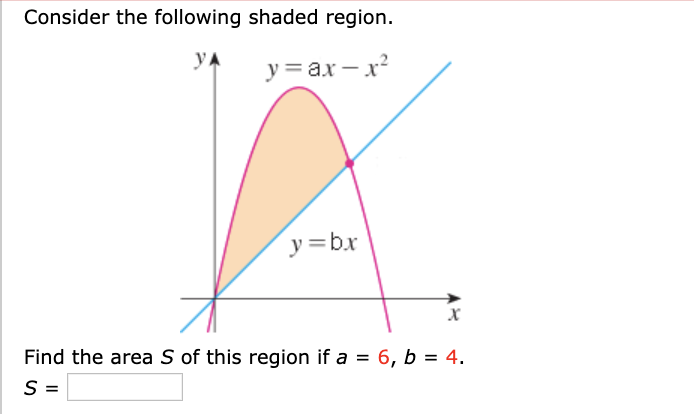
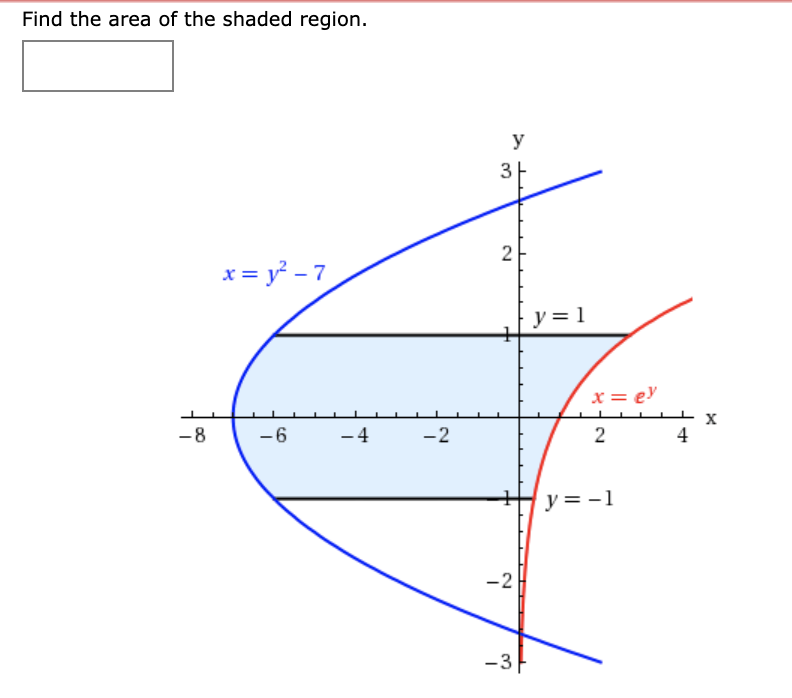
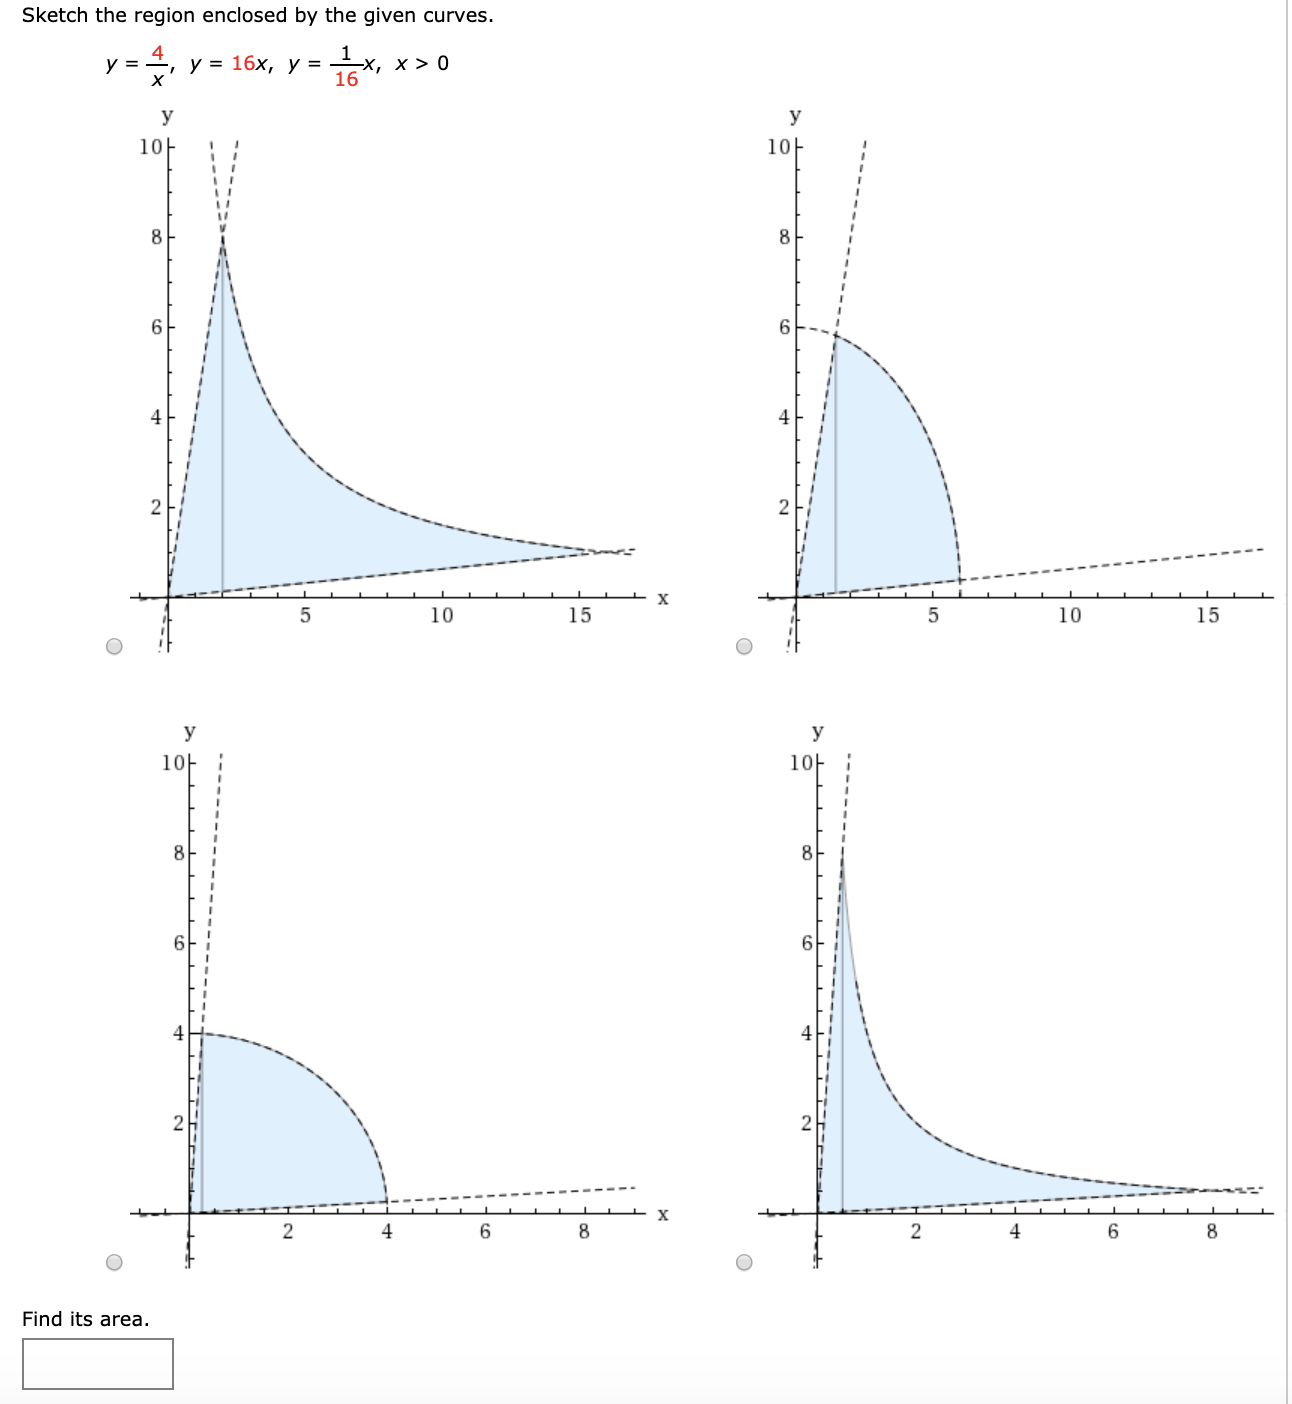
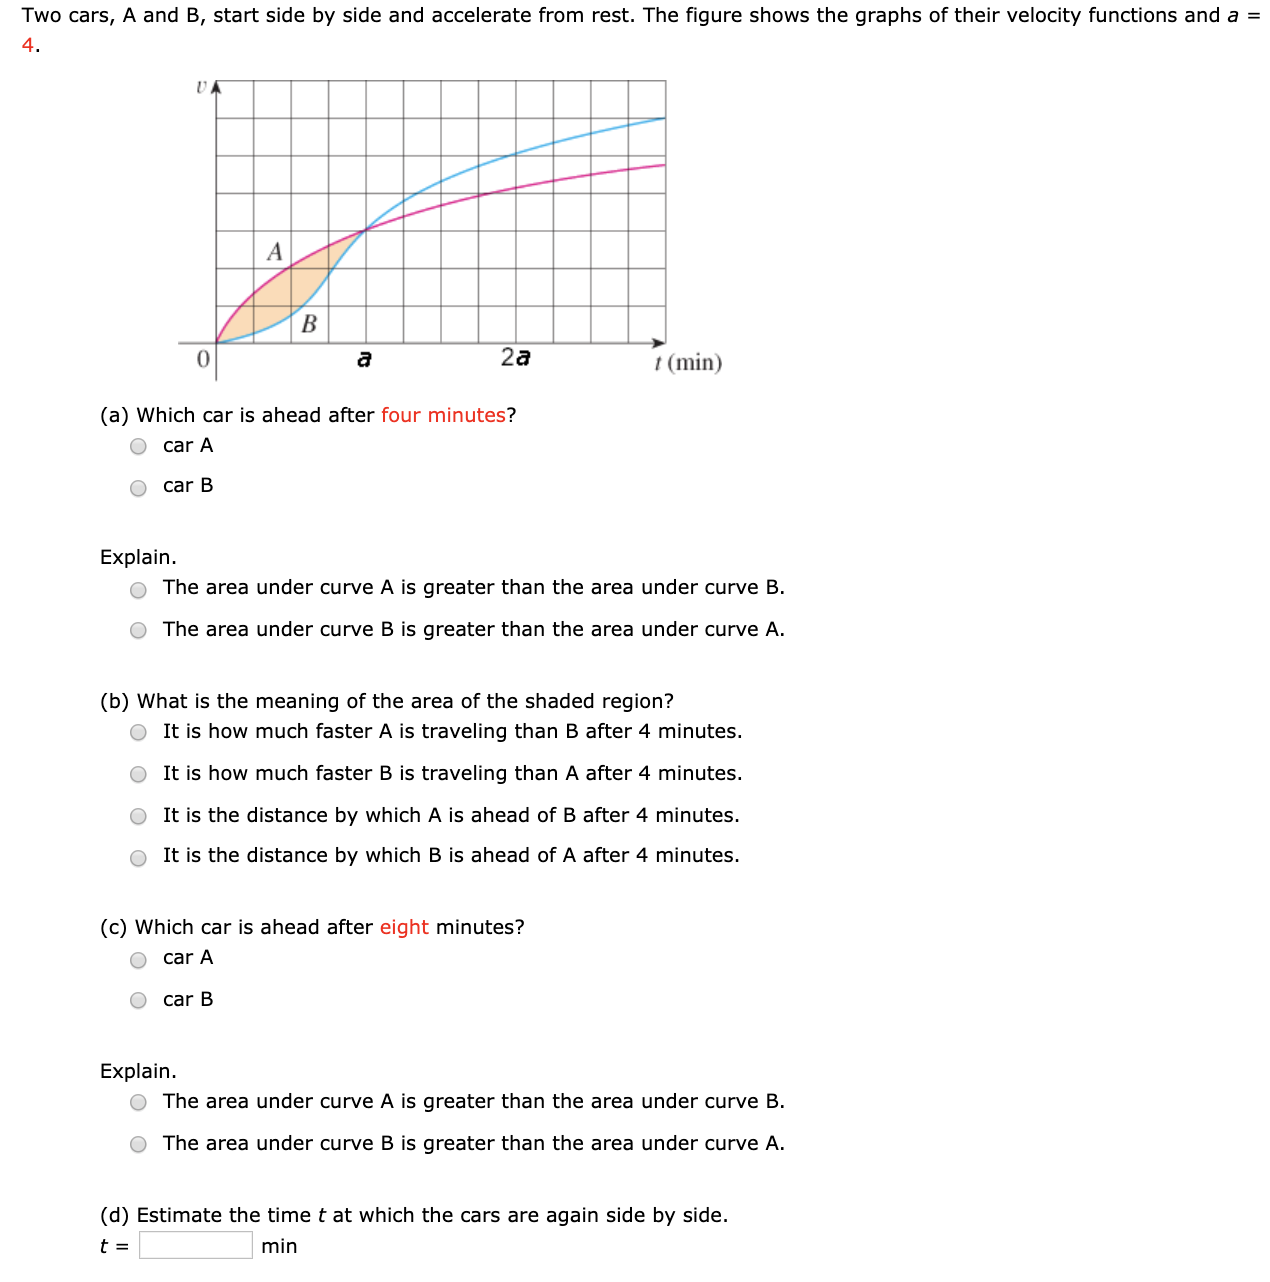
Consider the following shaded region. y Find the area S of this region if a = 6, b = 4. S = \fSketch the region enclosed by the given curves. Decide whether to integrate with respect to x or y. Draw a typical approximating rectangle and label its height and width. (Do this on paper. Your instructor may ask you to turn in this graph.) y=812.y2= 1r DOIH Then nd the area S of the region. 5 = Sketch the region enclosed by the given curves. Decide whether to integrate with respect to x or 3/. Draw a typical approximating rectangle and label its height and width. (Do this on paper. Your instructor may ask you to turn in this graph.) I=55y271=5y25 Then nd the area S of the region. 5 = Sketch the region enclosed by the given curves. Decide whether to integrate with respect to x or y. Draw a typical approximating rectangle and label its height and width. (Do this on paper. Your instructor may ask you to turn in this graph.) 1'. = 7y2,.c= 9+5y2 Then nd the area S of the region. 5 = Sketch the region enclosed by the given curves. y' y = 16 x, y = => x, x>0 y 10/ 101 8 6 6 4 2 2 5 L X 10 15 5 10 15 O 4 y 101 41 4 N N 6 8 X 6 8 Find its area.Two cars, A and B, start side by side and accelerate from rest. The figure shows the graphs of their velocity functions and a = 4. A B a 2a t (min) (a) Which car is ahead after four minutes? O car A O car B Explain. The area under curve A is greater than the area under curve B. The area under curve B is greater than the area under curve A. (b) What is the meaning of the area of the shaded region? O It is how much faster A is traveling than B after 4 minutes. O It is how much faster B is traveling than A after 4 minutes. It is the distance by which A is ahead of B after 4 minutes. It is the distance by which B is ahead of A after 4 minutes. (c) Which car is ahead after eight minutes? O car A car B Explain. O The area under curve A is greater than the area under curve B. The area under curve B is greater than the area under curve A. (d) Estimate the time t at which the cars are again side by side. t = minThe birth rate of a population is b(t) = 2400e0'023t people per year and the death rate is d(t)= 1470e0'019t people per year, nd the area between these curves for 0 S t s 10. (Round your answer to the nearest integer.) people What does this area represent? 0 This area represents the number of births over a 10-year period. This area represents the increase in population over a 10-year period. This area represents the decrease in population over a 10-year period. This area represents the number of deaths over a 10-year period. 0000 This area represent the number of children through high school over a 10-year period


