

Question
NEED HELP! ESPECIALLY WITH THE HIGHLIGHTED QUESTIONS Bayberry General Hospital - Never Event Case Study The healthcare insurance industry has recently decided to get tough.
NEED HELP! ESPECIALLY WITH THE HIGHLIGHTED QUESTIONS
Bayberry General Hospital - Never Event Case Study
The healthcare insurance industry has recently decided to get tough. Many have started a policy that, for things they feel shouldnt occur at all during a hospital stay (which they call never events), the hospital will not get reimbursement for the additional expenses incurred to treat them. The theory is that, if people were truly accountable and just did their jobs, these things should not occur!
Bayberry General Hospitals performance is shown below in a typical bar graph/trend line display.
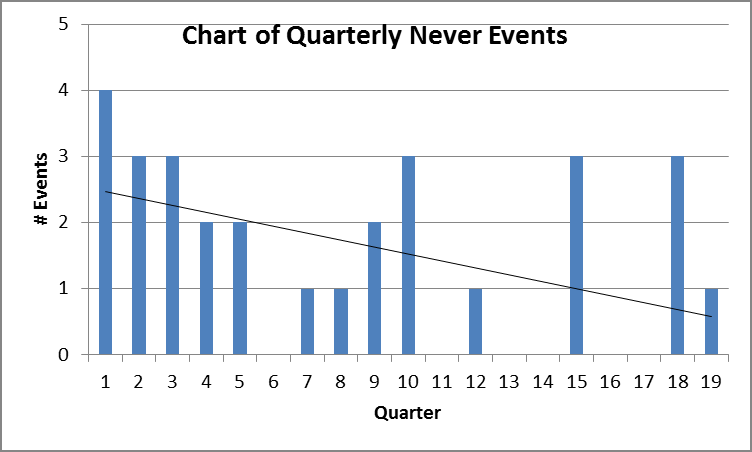
Their executive feels that the overall trend looks good, especially given the six quarters of zero. But she is concerned by the excessive number of quarters with three events, especially since the last two occurred after a quarter of zero. She insisted on going back to do all the root cause analyses for the past two years. The board is really applying pressure by insisting on no more than one incident per quarter and a special report to them with a proposed action plan if two or more occur.
Prepare a 4-5 page paper to answer the following questions and analyze the additional data and charts.
- Is there statistical evidence that the root cause analyses have helped?
- Is the trend line in the above bar graph insightful?
- From this data, construct a run chart.
- Based on your chart, is there any statistical evidence of either a downward trend or a beneficial process shift? Is it OK to take the average of all the data?
- Sketch a control chart. (Overall average = 1.53)
- Is a quarter of zero events a common or special cause? Should it be celebrated?
- Will the boards tough goal of no more than one never event per quarter and special reports to them with action plans when two or more occur be helpful in improving safety?
- What might be a productive strategy at this point?
- One person wanted more data. With a lot of difficulties, we were able to obtain two more years of data eight more quarters: 1, 0, 3, 4, 0, 0, 3, 1
- Adding these data to the beginning, re-sketch the run chart. Does this help you gain additional insight?
- Based on this analysis, re-construct the IChart (control chart).
- Do these two charts suggest how these additional data might prove to be helpful?
Step by Step Solution
There are 3 Steps involved in it
Step: 1

Get Instant Access to Expert-Tailored Solutions
See step-by-step solutions with expert insights and AI powered tools for academic success
Step: 2

Step: 3
Ace Your Homework with AI
Get the answers you need in no time with our AI-driven, step-by-step assistance
Get Started
Strategy Mapping For Learning Organizations Building Agility Into Your Balanced Scorecard
Authors: Phil Jones
1st Edition
0566088118,1409459292