Need help filling in the cells below
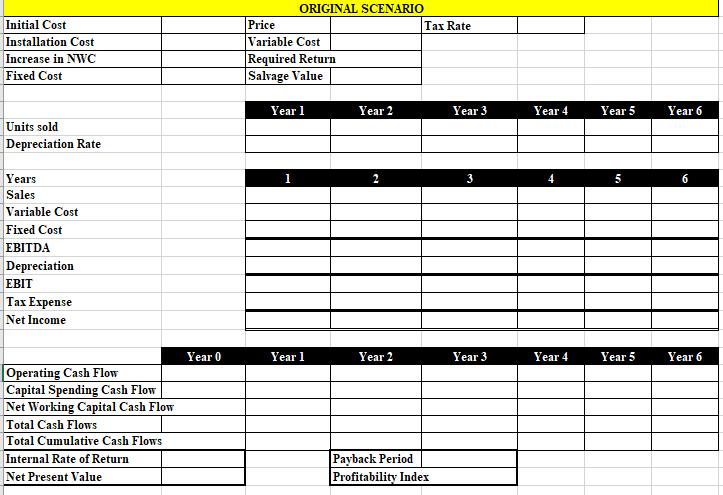
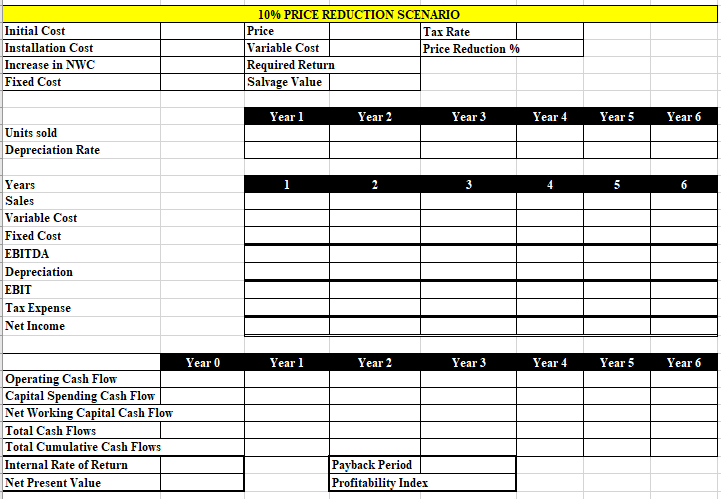
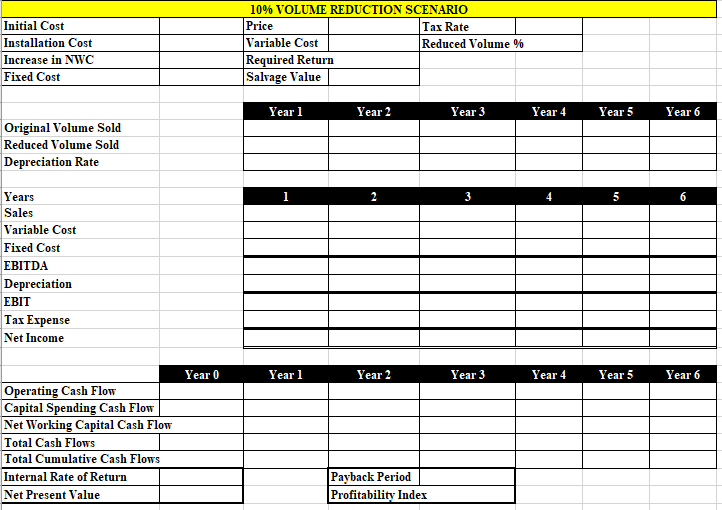
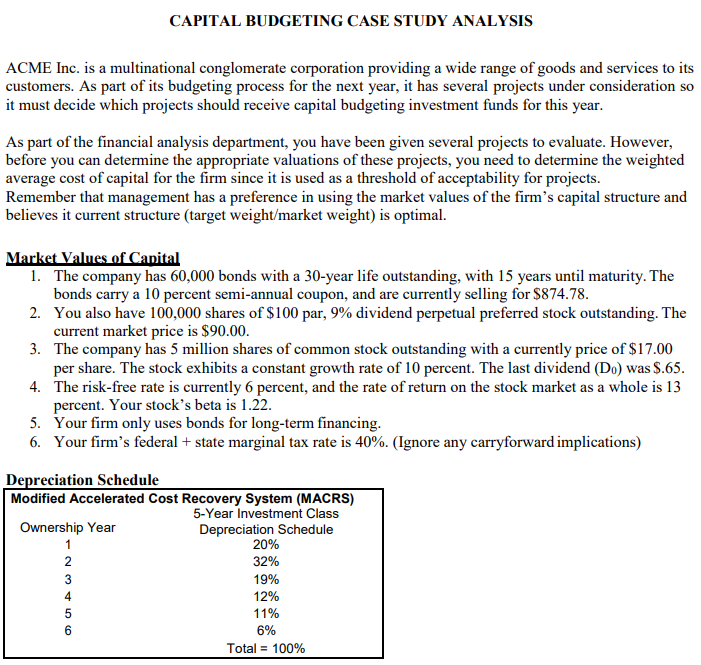
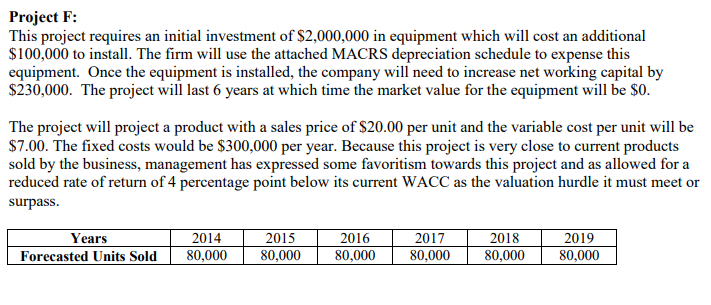
CAPITAL BUDGETING CASE STUDY ANALYSIS ACME Inc. is a multinational conglomerate corporation providing a wide range of goods and services to its customers. As part of its budgeting process for the next year, it has several projects under consideration so it must decide which projects should receive capital budgeting investment funds for this year. As part of the financial analysis department, you have been given several projects to evaluate. However, before you can determine the appropriate valuations of these projects, you need to determine the weighted average cost of capital for the firm since it is used as a threshold of acceptability for projects. Remember that management has a preference in using the market values of the firm's capital structure and believes it current structure (target weight/market weight) is optimal. Market Values of Capital 1. The company has 60,000 bonds with a 30-year life outstanding, with 15 years until maturity. The bonds carry a 10 percent semi-annual coupon, and are currently selling for $874.78. 2. You also have 100,000 shares of $100 par, 9% dividend perpetual preferred stock outstanding. The current market price is $90.00. 3. The company has 5 million shares of common stock outstanding with a currently price of $17.00 per share. The stock exhibits a constant growth rate of 10 percent. The last dividend (Do) was 9.65. 4. The risk-free rate is currently 6 percent, and the rate of return on the stock market as a whole is 13 percent. Your stock's beta is 1.22. 5. Your firm only uses bonds for long-term financing. 6. Your firm's federal + state marginal tax rate is 40%. (Ignore any carryforward implications) Depreciation Schedule Modified Accelerated Cost Recovery System (MACRS) 5-Year Investment Class Ownership Year Depreciation Schedule 20% 2 32% 3 19% 12% 11% 6% Total = 100% 4 5 6 Project F: This project requires an initial investment of $2,000,000 in equipment which will cost an additional $100,000 to install. The firm will use the attached MACRS depreciation schedule to expense this equipment. Once the equipment is installed, the company will need to increase net working capital by $230,000. The project will last 6 years at which time the market value for the equipment will be $0. The project will project a product with a sales price of $20.00 per unit and the variable cost per unit will be $7.00. The fixed costs would be $300,000 per year. Because this project is very close to current products sold by the business, management has expressed some favoritism towards this project and as allowed for a reduced rate of return of 4 percentage point below its current WACC as the valuation hurdle it must meet or surpass. Years Forecasted Units Sold 2014 80,000 2015 80,000 2016 80,000 2017 80,000 2018 80,000 2019 80,000 Initial Cost Installation Cost Increase in NWC Fixed Cost ORIGINAL SCENARIO Price Tax Rate Variable Cost Required Return Salvage Value Year 1 Year 2 Year 3 Year 4 Year 5 Year 6 Units sold Depreciation Rate 1 2 3 4 5 6 Years Sales Variable Cost Fixed Cost EBITDA Depreciation EBIT Tax Expense Net Income Year 0 Year 1 Year 2 Year 3 Year 4 Year 5 Year 6 Operating Cash Flow Capital Spending Cash Flow Net Working Capital Cash Flow Total Cash Flows Total Cumulative Cash Flows Internal Rate of Return Net Present Value Payback Period Profitability Index Initial Cost Installation Cost Increase in NWC Fixed Cost 10% PRICE REDUCTION SCENARIO Price Tax Rate Variable Cost Price Reduction % Required Return Salvage Value Year 1 Year 2 Year 3 Year 4 Year 5 Year 6 Units sold Depreciation Rate 2 3 5 6 Years Sales Variable Cost Fixed Cost EBITDA Depreciation EBIT Tax Expense Net Income Year 0 Yearl Year 2 Year 3 Year 4 Year 5 Year 6 Operating Cash Flow Capital Spending Cash Flow Net Working Capital Cash Flow Total Cash Flows Total Cumulative Cash Flows Internal Rate of Return Net Present Value Payback Period Profitability Index Initial Cost Installation Cost Increase in NWC Fixed Cost 10% VOLUME REDUCTION SCENARIO Price Tax Rate Variable Cost Reduced Volume % Required Return Salvage Value Year 1 Year 2 Year 3 Year 4 Year 5 Year 6 Original Volume Sold Reduced Volume Sold Depreciation Rate 3 5 Years Sales Variable Cost Fixed Cost EBITDA Depreciation EBIT Tax Expense Net Income Year 0 Year 1 Year 2 Year 3 Year 4 Year 5 Year 6 Operating Cash Flow Capital Spending Cash Flow Net Working Capital Cash Flow Total Cash Flows Total Cumulative Cash Flows Internal Rate of Return Net Present Value Payback Period Profitability Index CAPITAL BUDGETING CASE STUDY ANALYSIS ACME Inc. is a multinational conglomerate corporation providing a wide range of goods and services to its customers. As part of its budgeting process for the next year, it has several projects under consideration so it must decide which projects should receive capital budgeting investment funds for this year. As part of the financial analysis department, you have been given several projects to evaluate. However, before you can determine the appropriate valuations of these projects, you need to determine the weighted average cost of capital for the firm since it is used as a threshold of acceptability for projects. Remember that management has a preference in using the market values of the firm's capital structure and believes it current structure (target weight/market weight) is optimal. Market Values of Capital 1. The company has 60,000 bonds with a 30-year life outstanding, with 15 years until maturity. The bonds carry a 10 percent semi-annual coupon, and are currently selling for $874.78. 2. You also have 100,000 shares of $100 par, 9% dividend perpetual preferred stock outstanding. The current market price is $90.00. 3. The company has 5 million shares of common stock outstanding with a currently price of $17.00 per share. The stock exhibits a constant growth rate of 10 percent. The last dividend (Do) was 9.65. 4. The risk-free rate is currently 6 percent, and the rate of return on the stock market as a whole is 13 percent. Your stock's beta is 1.22. 5. Your firm only uses bonds for long-term financing. 6. Your firm's federal + state marginal tax rate is 40%. (Ignore any carryforward implications) Depreciation Schedule Modified Accelerated Cost Recovery System (MACRS) 5-Year Investment Class Ownership Year Depreciation Schedule 20% 2 32% 3 19% 12% 11% 6% Total = 100% 4 5 6 Project F: This project requires an initial investment of $2,000,000 in equipment which will cost an additional $100,000 to install. The firm will use the attached MACRS depreciation schedule to expense this equipment. Once the equipment is installed, the company will need to increase net working capital by $230,000. The project will last 6 years at which time the market value for the equipment will be $0. The project will project a product with a sales price of $20.00 per unit and the variable cost per unit will be $7.00. The fixed costs would be $300,000 per year. Because this project is very close to current products sold by the business, management has expressed some favoritism towards this project and as allowed for a reduced rate of return of 4 percentage point below its current WACC as the valuation hurdle it must meet or surpass. Years Forecasted Units Sold 2014 80,000 2015 80,000 2016 80,000 2017 80,000 2018 80,000 2019 80,000 Initial Cost Installation Cost Increase in NWC Fixed Cost ORIGINAL SCENARIO Price Tax Rate Variable Cost Required Return Salvage Value Year 1 Year 2 Year 3 Year 4 Year 5 Year 6 Units sold Depreciation Rate 1 2 3 4 5 6 Years Sales Variable Cost Fixed Cost EBITDA Depreciation EBIT Tax Expense Net Income Year 0 Year 1 Year 2 Year 3 Year 4 Year 5 Year 6 Operating Cash Flow Capital Spending Cash Flow Net Working Capital Cash Flow Total Cash Flows Total Cumulative Cash Flows Internal Rate of Return Net Present Value Payback Period Profitability Index Initial Cost Installation Cost Increase in NWC Fixed Cost 10% PRICE REDUCTION SCENARIO Price Tax Rate Variable Cost Price Reduction % Required Return Salvage Value Year 1 Year 2 Year 3 Year 4 Year 5 Year 6 Units sold Depreciation Rate 2 3 5 6 Years Sales Variable Cost Fixed Cost EBITDA Depreciation EBIT Tax Expense Net Income Year 0 Yearl Year 2 Year 3 Year 4 Year 5 Year 6 Operating Cash Flow Capital Spending Cash Flow Net Working Capital Cash Flow Total Cash Flows Total Cumulative Cash Flows Internal Rate of Return Net Present Value Payback Period Profitability Index Initial Cost Installation Cost Increase in NWC Fixed Cost 10% VOLUME REDUCTION SCENARIO Price Tax Rate Variable Cost Reduced Volume % Required Return Salvage Value Year 1 Year 2 Year 3 Year 4 Year 5 Year 6 Original Volume Sold Reduced Volume Sold Depreciation Rate 3 5 Years Sales Variable Cost Fixed Cost EBITDA Depreciation EBIT Tax Expense Net Income Year 0 Year 1 Year 2 Year 3 Year 4 Year 5 Year 6 Operating Cash Flow Capital Spending Cash Flow Net Working Capital Cash Flow Total Cash Flows Total Cumulative Cash Flows Internal Rate of Return Net Present Value Payback Period Profitability Index