

Answered step by step
Verified Expert Solution
Question
1 Approved Answer
NEED HELP FILLING IN THESE LAST THREE PLEASE: (THE CALCULATIONS ON THE TWO INCOME STATEMENTS I THINK I DID WRONG) 5 Horizontal Analysis - Balance
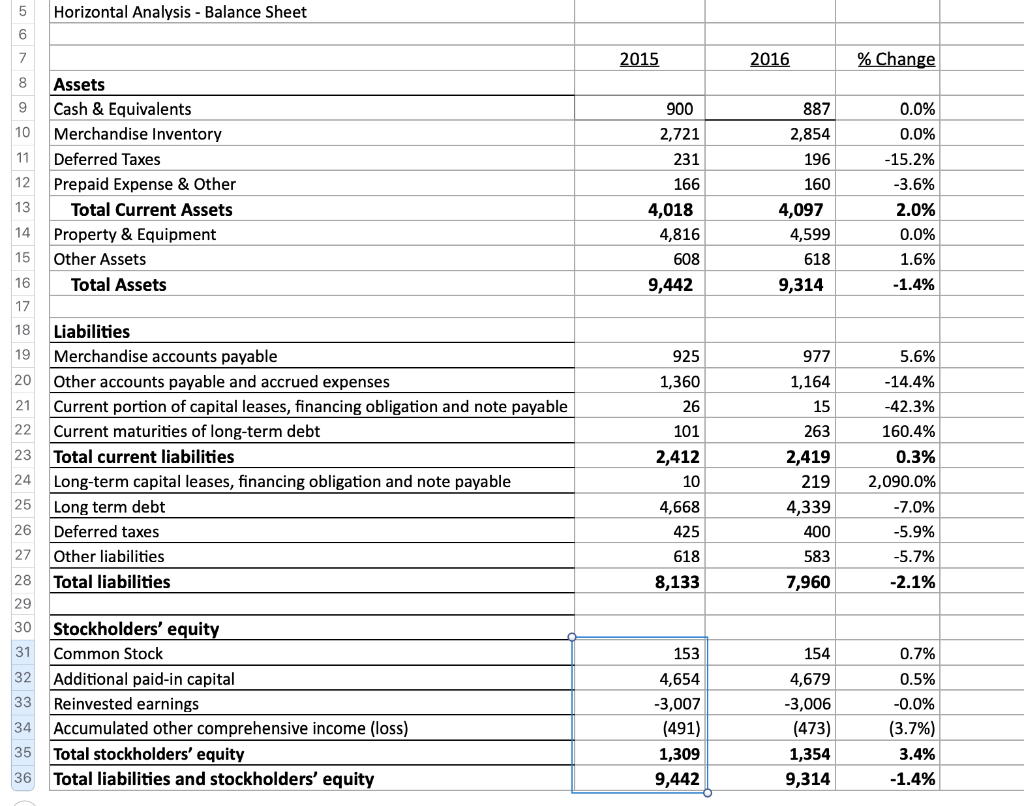
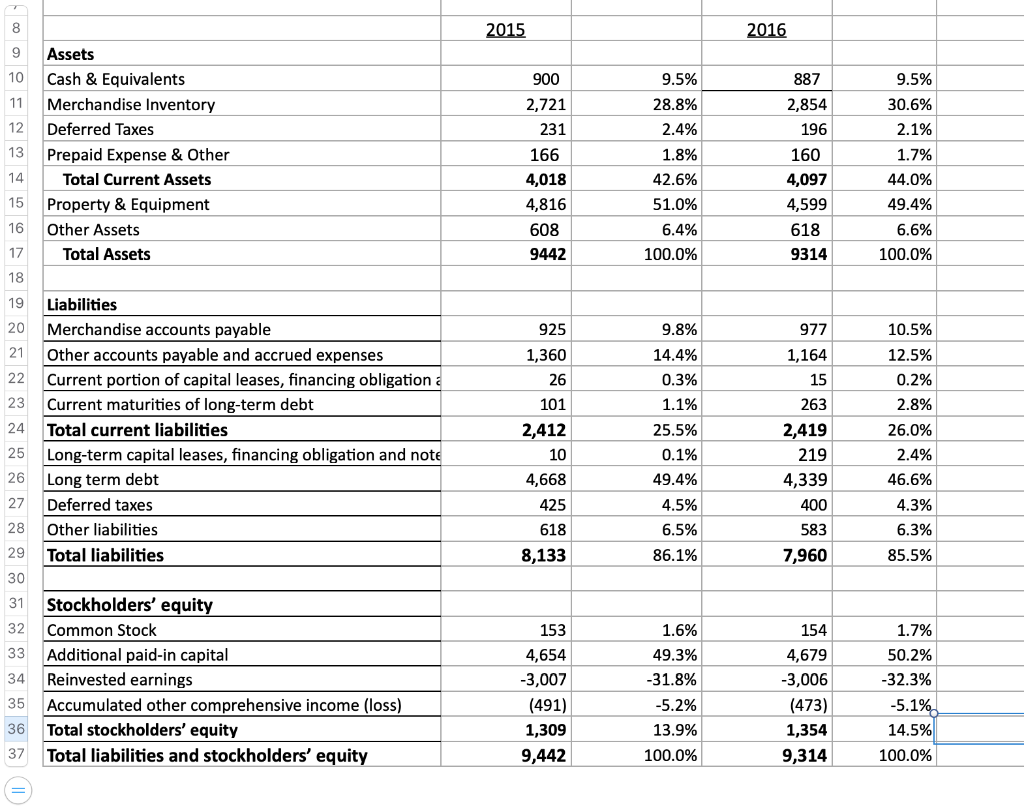
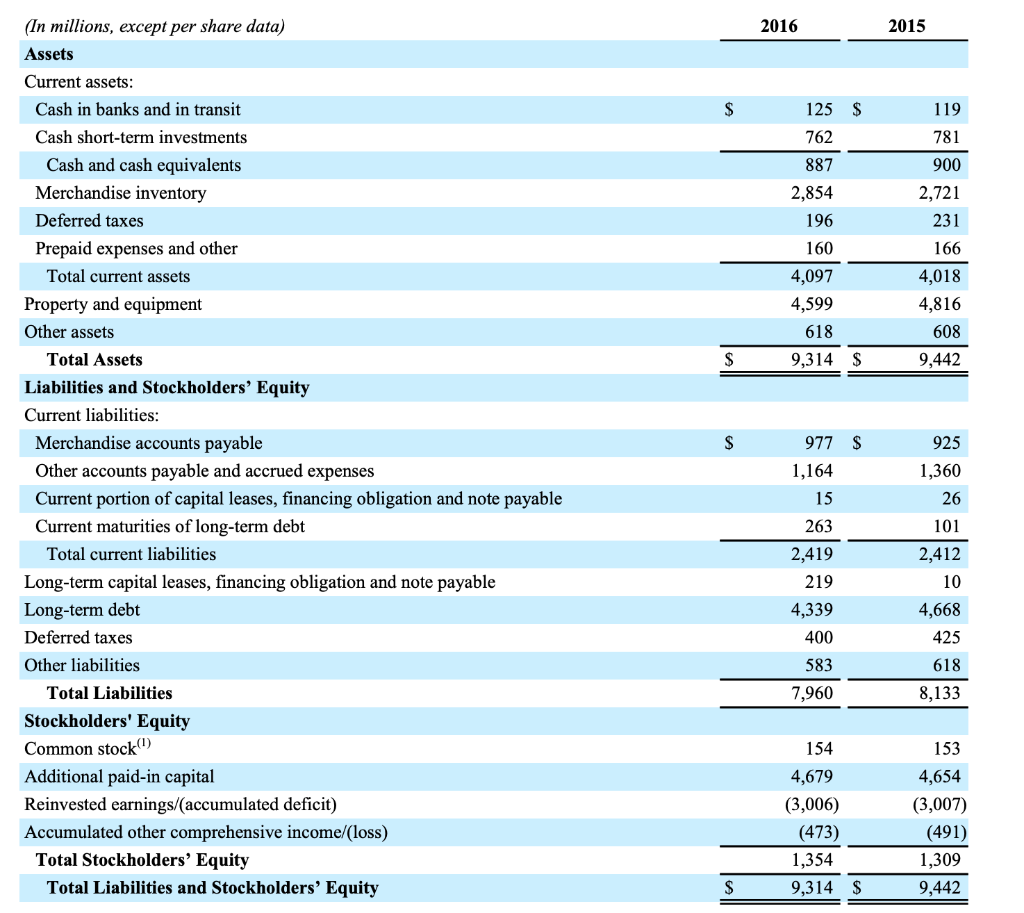


NEED HELP FILLING IN THESE LAST THREE PLEASE: (THE CALCULATIONS ON THE TWO INCOME STATEMENTS I THINK I DID WRONG)


5 Horizontal Analysis - Balance Sheet 6 7 2015 2016 % Change 8 9 10 11 12 Assets Cash & Equivalents Merchandise Inventory Deferred Taxes Prepaid Expense & Other Total Current Assets Property & Equipment Other Assets Total Assets 900 2,721 231 166 4,018 4,816 608 9,442 887 2,854 196 160 4,097 4,599 618 9,314 0.0% 0.0% -15.2% -3.6% 2.0% 0.0% 1.6% 13 14 15 16 -1.4% 17 925 1,360 26 18 Liabilities 19 Merchandise accounts payable 20 Other accounts payable and accrued expenses 21 Current portion of capital leases, financing obligation and note payable 22 Current maturities of long-term debt 23 Total current liabilities 24 Long-term capital leases, financing obligation and note payable 25 Long term debt 26 Deferred taxes 27 Other liabilities 28 Total liabilities 29 30 Stockholders' equity 31 Common Stock 32 Additional paid-in capital 33 Reinvested earnings 34 Accumulated other comprehensive income (loss) 35 Total stockholders' equity 36 Total liabilities and stockholders' equity 101 2,412 10 4,668 425 618 8,133 977 1,164 15 263 2,419 219 4,339 400 583 7,960 5.6% -14.4% -42.3% 160.4% 0.3% 2,090.0% -7.0% -5.9% -5.7% -2.1% 153 4,654 -3,007 (491) 1,309 9,442 154 4,679 -3,006 (473) 1,354 9,314 0.7% 0.5% -0.0% (3.7%) 3.4% -1.4% 8 2015 2016 9 10 11 9.5% 28.8% 2.4% 12 Assets Cash & Equivalents Merchandise Inventory Deferred Taxes Prepaid Expense & Other Total Current Assets Property & Equipment Other Assets Total Assets 900 2,721 231 166 4,018 4,816 608 9442 887 2,854 196 160 4,097 4,599 13 14 9.5% 30.6% 2.1% 1.7% 44.0% 49.4% 15 1.8% 42.6% 51.0% 6.4% 100.0% 16 618 9314 6.6% 100.0% 17 18 19 925 977 20 21 1,164 9.8% 14.4% 0.3% 1.1% 15 22 23 263 24 Liabilities Merchandise accounts payable Other accounts payable and accrued expenses Current portion of capital leases, financing obligation a Current maturities of long-term debt Total current liabilities Long-term capital leases, financing obligation and note Long term debt Deferred taxes Other liabilities Total liabilities 1,360 26 101 2,412 10 4,668 425 618 8,133 25 26 27 28 25.5% 0.1% 49.4% 4.5% 6.5% 86.1% 10.5% 12.5% 0.2% 2.8% 26.0% 2.4% 46.6% 4.3% 6.3% 85.5% 2,419 219 4,339 400 583 7,960 29 30 31 32 33 34 Stockholders' equity Common Stock Additional paid-in capital Reinvested earnings Accumulated other comprehensive income (loss) Total stockholders' equity Total liabilities and stockholders' equity 153 4,654 -3,007 (491) 1,309 9,442 1.6% 49.3% -31.8% -5.2% 13.9% 100.0% 35 36 154 4,679 -3,006 (473) 1,354 9,314 1.7% 50.2% -32.3% -5.1% 14.5% 100.0% 37 2016 2015 $ 125 $ 762 887 2,854 196 160 4,097 4,599 119 781 900 2,721 231 166 4,018 4,816 608 9,442 618 $ 9,314 $ $ 977 $ (In millions, except per share data) Assets Current assets: Cash in banks and in transit Cash short-term investments Cash and cash equivalents Merchandise inventory Deferred taxes Prepaid expenses and other Total current assets Property and equipment Other assets Total Assets Liabilities and Stockholders' Equity Current liabilities: Merchandise accounts payable Other accounts payable and accrued expenses Current portion of capital leases, financing obligation and note payable Current maturities of long-term debt Total current liabilities Long-term capital leases, financing obligation and note payable Long-term debt Deferred taxes Other liabilities Total Liabilities Stockholders' Equity Common stock(1) Additional paid-in capital Reinvested earnings/accumulated deficit) Accumulated other comprehensive income/loss) Total Stockholders' Equity Total Liabilities and Stockholders' Equity 1,164 15 263 2,419 219 4,339 400 583 7,960 925 1,360 26 101 2,412 10 4,668 425 618 8,133 154 4,679 (3,006) (473) 1,354 9,314 $ 153 4,654 (3,007) (491) 1,309 9,442 S 2016 2015 2014 $ 12,547 $ 8,071 4,476 12,625 $ 8,074 4,551 12,257 7,996 4,261 3,538 3,775 162 19 609 616 3 (In millions, except per share data) Total net sales Cost of goods sold Gross margin Operating expenses/income): Selling, general and administrative (SG&A) Pension Depreciation and amortization Real estate and other, net Restructuring and management transition Total operating expenses Operating income/(loss) Loss on extinguishment of debt Net interest expense Income/loss) before income taxes Income tax expense/(benefit) Net income/(loss) Earnings/(loss) per share: Basic Diluted Weighted average shares basic Weighted average shares diluted 84 3,993 (48) 631 (148) 87 4,515 (254) 34 (111) 26 4,081 395 4,640 (89) 10 30 363 405 406 2 (504) 9 1 (694) 23 (717) $ 1 $ (513) $ (1.68) $ (1.68) 305.9 305.9 (2.35) (2.35) 305.2 308.1 313.0 305.2 2016 2015 2014 S 1 $ (513) $ (717) 10 32 25 39 TRE (1) 3 (5) (73) 30 (9) (9) 10 616 127 (25) (92) 34 631 (78) 33 609 (39) 35 44 (12) 9 3 283 (133) 11 52 (69) 19 (1) 49 (6) (147) (72) 4 257 (10) 58 334 440 239 ($ in millions) Cash flows from operating activities Net income/loss) Adjustments to reconcile net income/loss) to net cash provided by/(used in) operating activities: Restructuring and management transition Asset impairments and other charges Net gain on sale or redemption of non-operating assets Net gain on sale of operating assets Loss on extinguishment of debt Depreciation and amortization Benefit plans Stock-based compensation Other comprehensive income tax benefits Deferred taxes Change in cash from: Inventory Prepaid expenses and other assets Merchandise accounts payable Current income taxes Accrued expenses and other Net cash provided by/(used in) operating activities Cash flows from investing activities Capital expenditures Proceeds from sale or redemption of non-operating assets Proceeds from sale of operating assets Joint venture return of investment Net cash provided by/(used in) investing activities Cash flows from financing activities Payment on short-term borrowings Proceeds from issuance of long-term debt Proceeds from borrowings under the credit facility Payments of borrowings under the credit facility Net proceeds from financing obligation Premium on early retirement of debt Payments of capital leases, financing obligation and note payable Payments of long-term debt Financing costs Proceeds from stock options exercised Tax withholding payments for vested restricted stock Net cash provided by/(used in) financing activities Net increase/(decrease) in cash and cash equivalents Cash and cash equivalents at beginning of period Cash and cash equivalents at end of period (320) (427) 2 13 11 96 13 (316) (252) 35 70 5 (142) (296) (650) 893 2,188 667 (667) 216 (29) (2,349) (49) 2 (33) (520) (4) (33) (26) (412) (65) (10) (31) (13) 900 887 $ (5) (562) (418) 1,318 900 (1) (294) (197) 1,515 1,318 S $ 5 Common Size Vertical Analysis - Income Statement 6 7 8 9 2014 3,084,370 1,572,164 Net Revenues Cost of Goods Sold 100.0% 2015 3,963,313 2,057,766 100.0% 51.9% 2016 4,825,335 2,584,724 100.0% 53.6% 10 51.0% 11 12 =Gross Profit 1,512,206 49.0% 1,905,547 48.1% 2,240,611 46.4% 13 14 Sell, Gen & Admin Exp 1,158,251 37.6% 1,497,000 37.8% 1,823,140 37.8% 15 16 =Operating Income 353,955 11.5% 408,547 10.3% 417,471 8.7% 17 18 -0.2% -14628 -0.4% -26434 Interest Expense Other Expense (5,335) (6,410) -0.5% -0.1% 19 -0.2% -7234 -0.2% -2755 20 21 =Income before taxes 342,210 11.1% 386,685 9.8% 388,282 8.0% 22 23 Income Taxes 134,168 4.3% 154,112 3.9% 131,303 2.7% 24 25 =Net Income 208,042 6.7% 232,573 5.9% 256,979 5.3% 26 5 Horizontal Analysis - Income Statement 6 7 8 Net Revenues Cost of Goods Sold 2014 12,257 7,996 2015 12,625 8,074 % Change 3.0% 1.0% 2016 12,547 8,071 % Change -0.6% -0.0% 9 10 11 =Gross Profit 4,261 4,551 6.8% 4,476 -1.6% 12 13 Sell, Gen & Admin Exp 3,993 3,775 -5.5% 3,538 -6.3 14 15 =Operating Income 268 776 189.6% 938 17.3% 16 17 405 363 -10.4 Interest Expense Other Expense 406 -694 (0.2%) -27.4 18 -504 2 -100.4 19 20 =Income before taxes (20) 677 -3485.0% 1,303 92.5% 21 22 Income Taxes 23 9 -60.9% 1 -88.9 23 24 =Net Income 208,042 232,573 11.8% 197,979 -14.9 5 Ratio Analysis 2014 2015 2016 6 7 8 Liquidity Ratios Current Ratio Quick Ratio Cash Flow Liquidity Ratio 9 10 11 12 13 14 Activity Ratios Acct Receivable Turnover Days Sales Outstanding Inventory Turnover Acct Payable Turnover Days Payable Outstanding 15 16 17 18 19 20 Leverage Ratios Debt Ratio Debt to Equity Times Interest Earned 21 22 23 24 25 26 27 28 Profitablity Ratios Gross Profit Margin Operating Profit Margin Net Profit Margin Cash Flow Margin Return on Total Assets Return on Equity 29 30 31 32 33 Market Ratios Earning per Share Price to Earnings Ratio Dividend Yield 34 35 5 Horizontal Analysis - Balance Sheet 6 7 2015 2016 % Change 8 9 10 11 12 Assets Cash & Equivalents Merchandise Inventory Deferred Taxes Prepaid Expense & Other Total Current Assets Property & Equipment Other Assets Total Assets 900 2,721 231 166 4,018 4,816 608 9,442 887 2,854 196 160 4,097 4,599 618 9,314 0.0% 0.0% -15.2% -3.6% 2.0% 0.0% 1.6% 13 14 15 16 -1.4% 17 925 1,360 26 18 Liabilities 19 Merchandise accounts payable 20 Other accounts payable and accrued expenses 21 Current portion of capital leases, financing obligation and note payable 22 Current maturities of long-term debt 23 Total current liabilities 24 Long-term capital leases, financing obligation and note payable 25 Long term debt 26 Deferred taxes 27 Other liabilities 28 Total liabilities 29 30 Stockholders' equity 31 Common Stock 32 Additional paid-in capital 33 Reinvested earnings 34 Accumulated other comprehensive income (loss) 35 Total stockholders' equity 36 Total liabilities and stockholders' equity 101 2,412 10 4,668 425 618 8,133 977 1,164 15 263 2,419 219 4,339 400 583 7,960 5.6% -14.4% -42.3% 160.4% 0.3% 2,090.0% -7.0% -5.9% -5.7% -2.1% 153 4,654 -3,007 (491) 1,309 9,442 154 4,679 -3,006 (473) 1,354 9,314 0.7% 0.5% -0.0% (3.7%) 3.4% -1.4% 8 2015 2016 9 10 11 9.5% 28.8% 2.4% 12 Assets Cash & Equivalents Merchandise Inventory Deferred Taxes Prepaid Expense & Other Total Current Assets Property & Equipment Other Assets Total Assets 900 2,721 231 166 4,018 4,816 608 9442 887 2,854 196 160 4,097 4,599 13 14 9.5% 30.6% 2.1% 1.7% 44.0% 49.4% 15 1.8% 42.6% 51.0% 6.4% 100.0% 16 618 9314 6.6% 100.0% 17 18 19 925 977 20 21 1,164 9.8% 14.4% 0.3% 1.1% 15 22 23 263 24 Liabilities Merchandise accounts payable Other accounts payable and accrued expenses Current portion of capital leases, financing obligation a Current maturities of long-term debt Total current liabilities Long-term capital leases, financing obligation and note Long term debt Deferred taxes Other liabilities Total liabilities 1,360 26 101 2,412 10 4,668 425 618 8,133 25 26 27 28 25.5% 0.1% 49.4% 4.5% 6.5% 86.1% 10.5% 12.5% 0.2% 2.8% 26.0% 2.4% 46.6% 4.3% 6.3% 85.5% 2,419 219 4,339 400 583 7,960 29 30 31 32 33 34 Stockholders' equity Common Stock Additional paid-in capital Reinvested earnings Accumulated other comprehensive income (loss) Total stockholders' equity Total liabilities and stockholders' equity 153 4,654 -3,007 (491) 1,309 9,442 1.6% 49.3% -31.8% -5.2% 13.9% 100.0% 35 36 154 4,679 -3,006 (473) 1,354 9,314 1.7% 50.2% -32.3% -5.1% 14.5% 100.0% 37 2016 2015 $ 125 $ 762 887 2,854 196 160 4,097 4,599 119 781 900 2,721 231 166 4,018 4,816 608 9,442 618 $ 9,314 $ $ 977 $ (In millions, except per share data) Assets Current assets: Cash in banks and in transit Cash short-term investments Cash and cash equivalents Merchandise inventory Deferred taxes Prepaid expenses and other Total current assets Property and equipment Other assets Total Assets Liabilities and Stockholders' Equity Current liabilities: Merchandise accounts payable Other accounts payable and accrued expenses Current portion of capital leases, financing obligation and note payable Current maturities of long-term debt Total current liabilities Long-term capital leases, financing obligation and note payable Long-term debt Deferred taxes Other liabilities Total Liabilities Stockholders' Equity Common stock(1) Additional paid-in capital Reinvested earnings/accumulated deficit) Accumulated other comprehensive income/loss) Total Stockholders' Equity Total Liabilities and Stockholders' Equity 1,164 15 263 2,419 219 4,339 400 583 7,960 925 1,360 26 101 2,412 10 4,668 425 618 8,133 154 4,679 (3,006) (473) 1,354 9,314 $ 153 4,654 (3,007) (491) 1,309 9,442 S 2016 2015 2014 $ 12,547 $ 8,071 4,476 12,625 $ 8,074 4,551 12,257 7,996 4,261 3,538 3,775 162 19 609 616 3 (In millions, except per share data) Total net sales Cost of goods sold Gross margin Operating expenses/income): Selling, general and administrative (SG&A) Pension Depreciation and amortization Real estate and other, net Restructuring and management transition Total operating expenses Operating income/(loss) Loss on extinguishment of debt Net interest expense Income/loss) before income taxes Income tax expense/(benefit) Net income/(loss) Earnings/(loss) per share: Basic Diluted Weighted average shares basic Weighted average shares diluted 84 3,993 (48) 631 (148) 87 4,515 (254) 34 (111) 26 4,081 395 4,640 (89) 10 30 363 405 406 2 (504) 9 1 (694) 23 (717) $ 1 $ (513) $ (1.68) $ (1.68) 305.9 305.9 (2.35) (2.35) 305.2 308.1 313.0 305.2 2016 2015 2014 S 1 $ (513) $ (717) 10 32 25 39 TRE (1) 3 (5) (73) 30 (9) (9) 10 616 127 (25) (92) 34 631 (78) 33 609 (39) 35 44 (12) 9 3 283 (133) 11 52 (69) 19 (1) 49 (6) (147) (72) 4 257 (10) 58 334 440 239 ($ in millions) Cash flows from operating activities Net income/loss) Adjustments to reconcile net income/loss) to net cash provided by/(used in) operating activities: Restructuring and management transition Asset impairments and other charges Net gain on sale or redemption of non-operating assets Net gain on sale of operating assets Loss on extinguishment of debt Depreciation and amortization Benefit plans Stock-based compensation Other comprehensive income tax benefits Deferred taxes Change in cash from: Inventory Prepaid expenses and other assets Merchandise accounts payable Current income taxes Accrued expenses and other Net cash provided by/(used in) operating activities Cash flows from investing activities Capital expenditures Proceeds from sale or redemption of non-operating assets Proceeds from sale of operating assets Joint venture return of investment Net cash provided by/(used in) investing activities Cash flows from financing activities Payment on short-term borrowings Proceeds from issuance of long-term debt Proceeds from borrowings under the credit facility Payments of borrowings under the credit facility Net proceeds from financing obligation Premium on early retirement of debt Payments of capital leases, financing obligation and note payable Payments of long-term debt Financing costs Proceeds from stock options exercised Tax withholding payments for vested restricted stock Net cash provided by/(used in) financing activities Net increase/(decrease) in cash and cash equivalents Cash and cash equivalents at beginning of period Cash and cash equivalents at end of period (320) (427) 2 13 11 96 13 (316) (252) 35 70 5 (142) (296) (650) 893 2,188 667 (667) 216 (29) (2,349) (49) 2 (33) (520) (4) (33) (26) (412) (65) (10) (31) (13) 900 887 $ (5) (562) (418) 1,318 900 (1) (294) (197) 1,515 1,318 S $ 5 Common Size Vertical Analysis - Income Statement 6 7 8 9 2014 3,084,370 1,572,164 Net Revenues Cost of Goods Sold 100.0% 2015 3,963,313 2,057,766 100.0% 51.9% 2016 4,825,335 2,584,724 100.0% 53.6% 10 51.0% 11 12 =Gross Profit 1,512,206 49.0% 1,905,547 48.1% 2,240,611 46.4% 13 14 Sell, Gen & Admin Exp 1,158,251 37.6% 1,497,000 37.8% 1,823,140 37.8% 15 16 =Operating Income 353,955 11.5% 408,547 10.3% 417,471 8.7% 17 18 -0.2% -14628 -0.4% -26434 Interest Expense Other Expense (5,335) (6,410) -0.5% -0.1% 19 -0.2% -7234 -0.2% -2755 20 21 =Income before taxes 342,210 11.1% 386,685 9.8% 388,282 8.0% 22 23 Income Taxes 134,168 4.3% 154,112 3.9% 131,303 2.7% 24 25 =Net Income 208,042 6.7% 232,573 5.9% 256,979 5.3% 26 5 Horizontal Analysis - Income Statement 6 7 8 Net Revenues Cost of Goods Sold 2014 12,257 7,996 2015 12,625 8,074 % Change 3.0% 1.0% 2016 12,547 8,071 % Change -0.6% -0.0% 9 10 11 =Gross Profit 4,261 4,551 6.8% 4,476 -1.6% 12 13 Sell, Gen & Admin Exp 3,993 3,775 -5.5% 3,538 -6.3 14 15 =Operating Income 268 776 189.6% 938 17.3% 16 17 405 363 -10.4 Interest Expense Other Expense 406 -694 (0.2%) -27.4 18 -504 2 -100.4 19 20 =Income before taxes (20) 677 -3485.0% 1,303 92.5% 21 22 Income Taxes 23 9 -60.9% 1 -88.9 23 24 =Net Income 208,042 232,573 11.8% 197,979 -14.9 5 Ratio Analysis 2014 2015 2016 6 7 8 Liquidity Ratios Current Ratio Quick Ratio Cash Flow Liquidity Ratio 9 10 11 12 13 14 Activity Ratios Acct Receivable Turnover Days Sales Outstanding Inventory Turnover Acct Payable Turnover Days Payable Outstanding 15 16 17 18 19 20 Leverage Ratios Debt Ratio Debt to Equity Times Interest Earned 21 22 23 24 25 26 27 28 Profitablity Ratios Gross Profit Margin Operating Profit Margin Net Profit Margin Cash Flow Margin Return on Total Assets Return on Equity 29 30 31 32 33 Market Ratios Earning per Share Price to Earnings Ratio Dividend Yield 34 35
Step by Step Solution
There are 3 Steps involved in it
Step: 1

Get Instant Access to Expert-Tailored Solutions
See step-by-step solutions with expert insights and AI powered tools for academic success
Step: 2

Step: 3
Ace Your Homework with AI
Get the answers you need in no time with our AI-driven, step-by-step assistance
Get Started
Principles Of Financial Accounting Ch 1 17
Authors: Robert Libby, Patricia Libby, Fred Phillips, Stacey Whitecotton
1st Edition
0077370457, 9780077370459