Answered step by step
Verified Expert Solution
Question
1 Approved Answer
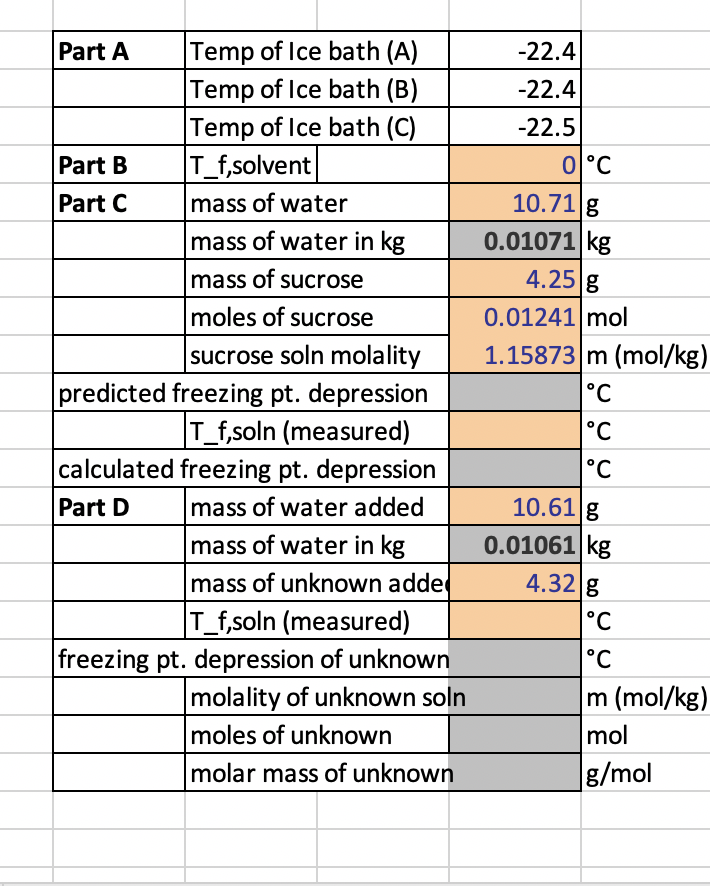
need help filling out the missing parts in the first picture. Second picture is attached for reference -22.41 -22.4 -22.5 0C 10.71 g 0.01071 kg


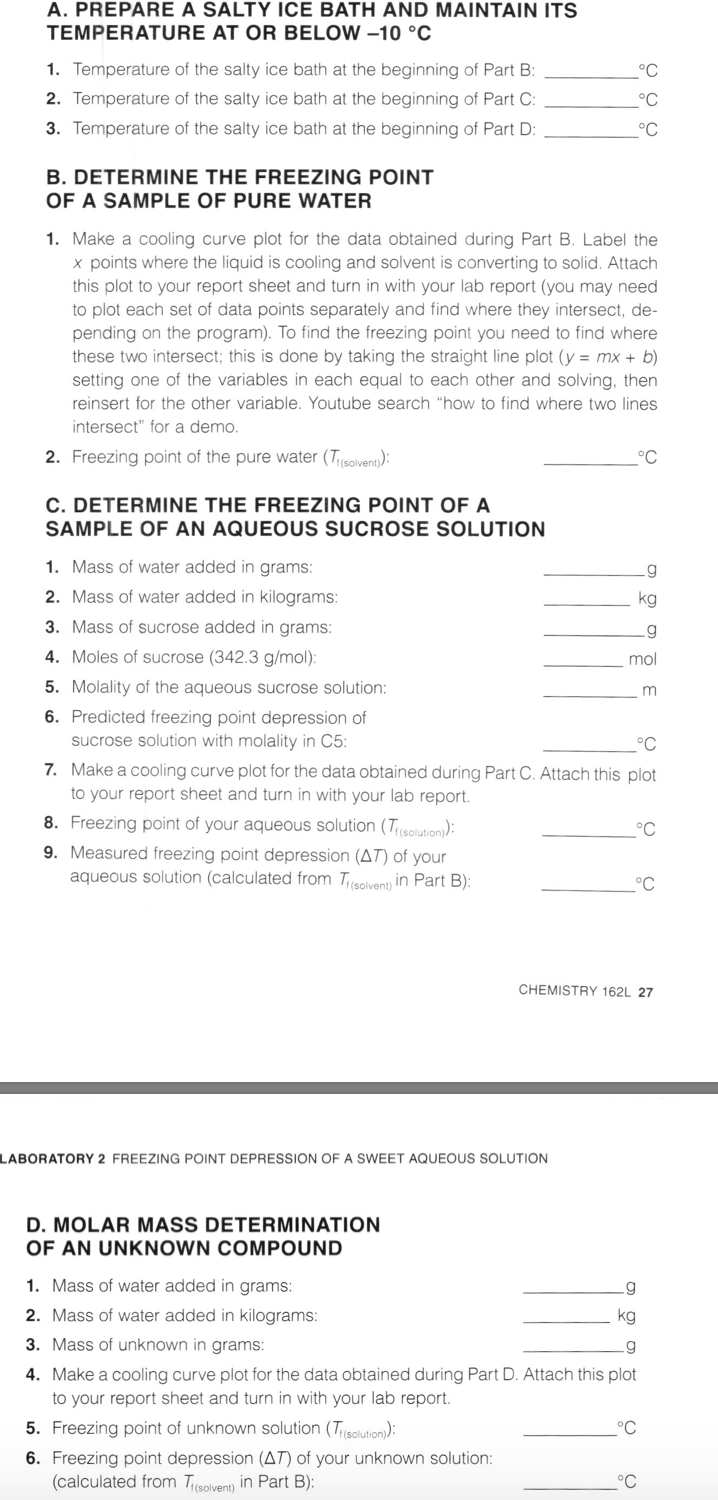
need help filling out the missing parts in the first picture. Second picture is attached for reference
-22.41 -22.4 -22.5 0C 10.71 g 0.01071 kg 4.25 g 0.01241 mol 1.15873 m (mol/kg) C Part A Temp of Ice bath (A) Temp of Ice bath (B) Temp of Ice bath (C) Part B T_f,solvent Part C mass of water mass of water in kg mass of sucrose moles of sucrose sucrose soln molality predicted freezing pt. depression T_f,soln (measured) calculated freezing pt. depression Part D mass of water added mass of water in kg mass of unknown adde T_f,soln (measured) freezing pt. depression of unknown molality of unknown soln moles of unknown molar mass of unknown C C 10.61 g 0.01061 kg 4.32 g C C m (mol/kg) mol g/mol A. PREPARE A SALTY ICE BATH AND MAINTAIN ITS TEMPERATURE AT OR BELOW -10 C C 1. Temperature of the salty ice bath at the beginning of Part B: 2. Temperature of the salty ice bath at the beginning of Part C: 3. Temperature of the salty ice bath at the beginning of Part D: C C B. DETERMINE THE FREEZING POINT OF A SAMPLE OF PURE WATER 1. Make a cooling curve plot for the data obtained during Part B. Label the x points where the liquid is cooling and solvent is converting to solid. Attach this plot to your report sheet and turn in with your lab report (you may need to plot each set of data points separately and find where they intersect, de- pending on the program). To find the freezing point you need to find where these two intersect; this is done by taking the straight line plot (y = mx + b) setting one of the variables in each equal to each other and solving, then reinsert for the other variable. Youtube search "how to find where two lines intersect" for a demo. 2. Freezing point of the pure water (Ti (solvent): C C. DETERMINE THE FREEZING POINT OF A SAMPLE OF AN AQUEOUS SUCROSE SOLUTION m 1. Mass of water added in grams: g 2. Mass of water added in kilograms: kg 3. Mass of sucrose added in grams: g 4. Moles of sucrose (342.3 g/mol); mol 5. Molality of the aqueous sucrose solution: 6. Predicted freezing point depression of sucrose solution with molality in C5: C 7. Make a cooling curve plot for the data obtained during Part C. Attach this plot to your report sheet and turn in with your lab report. 8. Freezing point of your aqueous solution (Tisolution): C 9. Measured freezing point depression (AT) of your aqueous solution (calculated from Ti (solvent in Part B): C CHEMISTRY 162L 27 LABORATORY 2 FREEZING POINT DEPRESSION OF A SWEET AQUEOUS SOLUTION D. MOLAR MASS DETERMINATION OF AN UNKNOWN COMPOUND g 1. Mass of water added in grams: g 2. Mass of water added in kilograms: kg 3. Mass of unknown in grams: 4. Make a cooling curve plot for the data obtained during Part D. Attach this plot to your report sheet and turn in with your lab report. 5. Freezing point of unknown solution (Tisolutions): 6. Freezing point depression (AT) of your unknown solution: (calculated from Ti(solvent) in Part B)Step by Step Solution
There are 3 Steps involved in it
Step: 1

Get Instant Access to Expert-Tailored Solutions
See step-by-step solutions with expert insights and AI powered tools for academic success
Step: 2

Step: 3

Ace Your Homework with AI
Get the answers you need in no time with our AI-driven, step-by-step assistance
Get Started


