Answered step by step
Verified Expert Solution
Question
1 Approved Answer
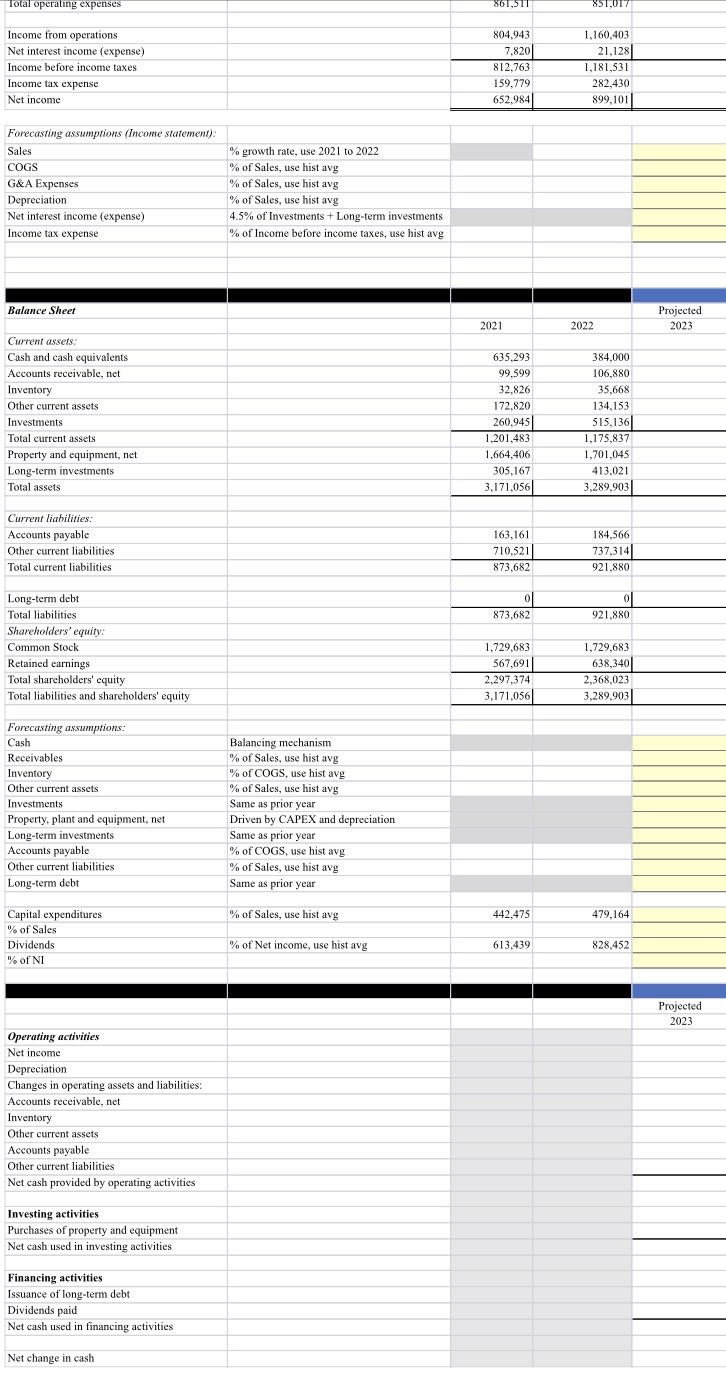
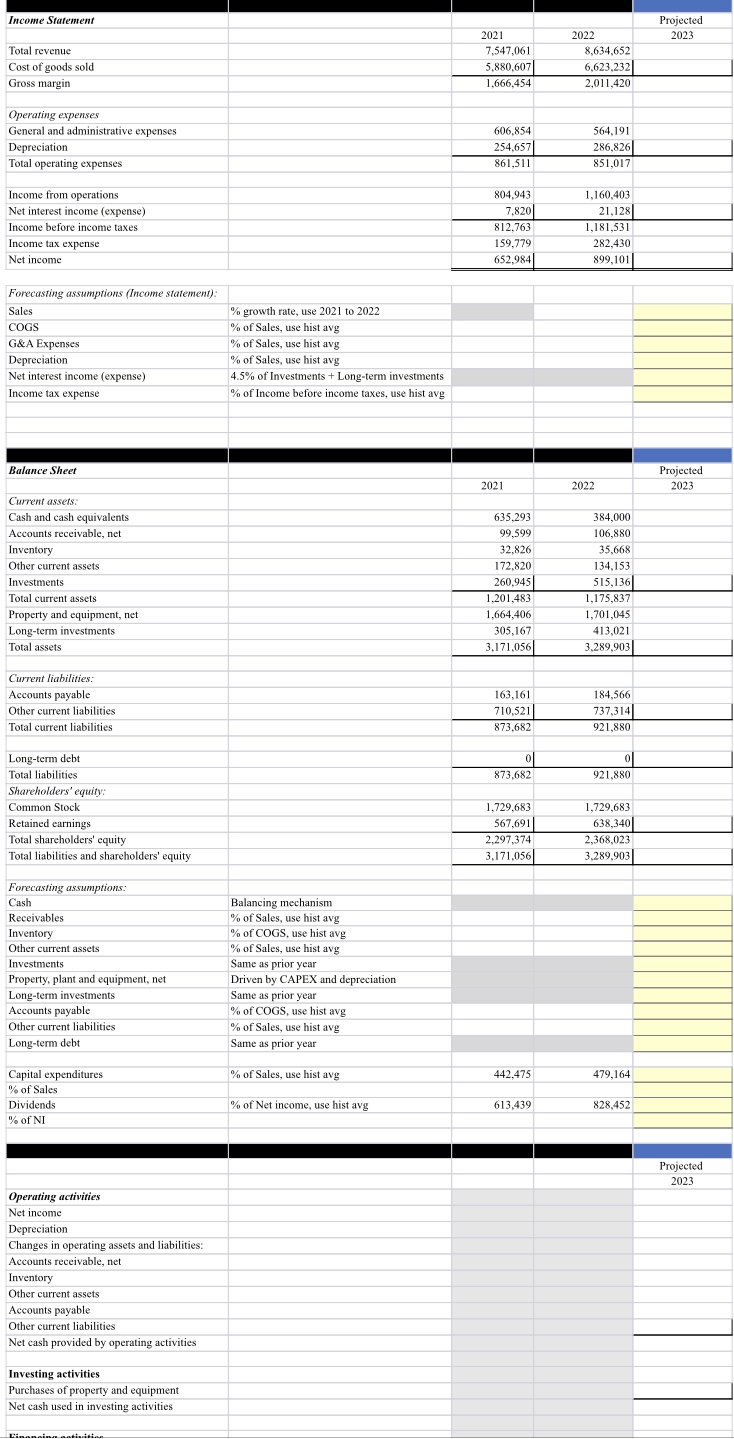
Need Help Filling out this (Using the text below): begin{tabular}{|c|c|c|c|c|} hline Income Statement & & & & Projected hline & & 2021 & 2022
Need Help Filling out this (Using the text below):


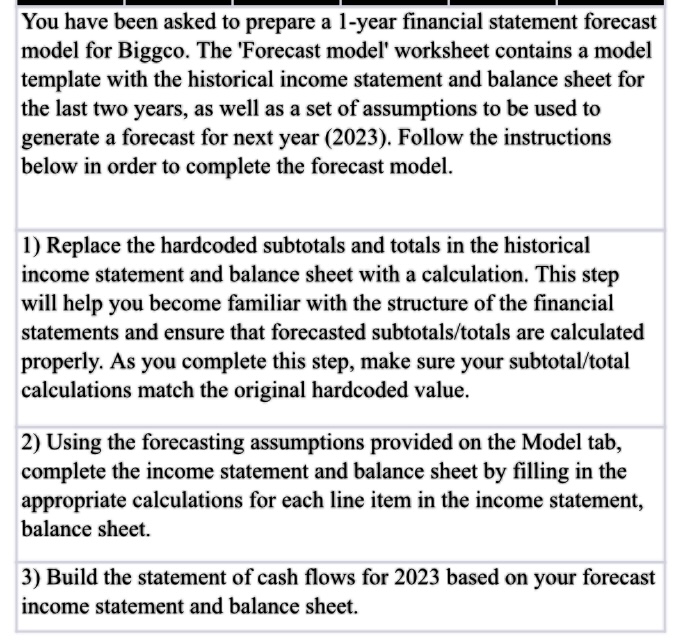
 \begin{tabular}{|c|c|c|c|c|} \hline Income Statement & & & & Projected \\ \hline & & 2021 & 2022 & 2023 \\ \hline Total revenue & & 7,547,061 & 8,634,652 & \\ \hline Cost of goods sold & & 5,880,607 & 6,623,232 & \\ \hline Gross margin & & 1,666,454 & 2,011,420 & \\ \hline \multicolumn{5}{|l|}{ Operating expenses } \\ \hline General and administrative expenses & & 606,854 & 564,191 & \\ \hline Depreciation & & 254,657 & 286,826 & \\ \hline Total operating expenses & & 861,511 & 851,017 & \\ \hline Income from operations & & 804,943 & 1.60403 & \\ \hline Net interest income (expense) & & 7,820 & 21,128 & \\ \hline Income before income taxes & & 812,763 & 1,181,531 & \\ \hline Income tax expense & & 159,779 & 282,430 & \\ \hline Net income & & 652,984 & 899,101 & \\ \hline \multicolumn{5}{|l|}{ Forecasting assumptions (Income statement): } \\ \hline Sales & % growth rate, use 2021 to 2022 & & & \\ \hline coGS & % of Sales, use hist avg & & & \\ \hline G\&A Expenses & % of Sales, use hist avg & & & \\ \hline Depreciation & % of Sales, use hist avg & & & \\ \hline Net interest income (expense) & 4.5% of Investments + Long-term investments & & & \\ \hline \multirow[t]{2}{*}{ Income tax expense } & % of Income before income taxes, use hist avg & & & \\ \hline & & & & \\ \hline \multirow[t]{2}{*}{ Balance Sheet } & & & & Projected \\ \hline & & 2021 & 2022 & 2023 \\ \hline \multicolumn{5}{|l|}{ Current assets: } \\ \hline Cash and cash equivalents & & 635,293 & 384,000 & \\ \hline Accounts receivable, net & & 99,599 & 106,880 & \\ \hline Inventory & & 32,826 & 35,668 & \\ \hline Other current assets & & 172,820 & 134,153 & \\ \hline Investments & & 260,945 & 515,136 & \\ \hline Total current assets & & 1,201,483 & 1,175,837 & \\ \hline Property and equipment, net & & 1,664,406 & 1,701,045 & \\ \hline Long-term investments & & 305,167 & 413,021 & \\ \hline Total assets & & 3,171,056 & 3,289,903 & \\ \hline \multicolumn{5}{|l|}{ Current liabilities: } \\ \hline Accounts payable & & 163,161 & 184,566 & \\ \hline Other current liabilities & & 710,521 & 737,314 & \\ \hline \begin{tabular}{l} Total current liabilities \\ T. \end{tabular} & & 873,682 & 921,880 & \\ \hline Long-term debt & & 0) & 0 & \\ \hline Total liabilities & & 10873,682 & 921,88001 & \\ \hline \multicolumn{5}{|l|}{ Shareholders' equity: } \\ \hline Common Stock & & 1,729,683 & 1,729,683 & \\ \hline Retained earnings & & 567,691 & 638,340 & \\ \hline Total shareholders' equity & & 2,297,374 & 2,368,023 & \\ \hline Total liabilities and shareholders' equity & & 3,171,056 & 3,289,903 & \\ \hline \multicolumn{5}{|l|}{ Forecasting assumptions: } \\ \hline \begin{tabular}{l} Forecasting assumptions: \\ Cash \end{tabular} & Balancing mechanism & & & \\ \hline Receivables & % of Sales, use hist avg & & & \\ \hline \begin{tabular}{l} Inventory \\ Inting \end{tabular} & % of COGS, use hist avg & & & \\ \hline Other current assets & % of Sales, use hist avg & & & \\ \hline Investments & Same as prior year & & & \\ \hline Property, plant and equipment, net & Driven by CAPEX and depreciation & & & \\ \hline Long-term investments & Same as prior year & & & \\ \hline Accounts payable & % of COGS, use hist avg & & & \\ \hline Other current liabilities & % of Sales, use hist avg & & & \\ \hline Long-term debt & Same as prior year & & & \\ \hline Capital expenditures & % of S ales, use hist avg & 442.475 & 479,164 & \\ \hline \multicolumn{5}{|l|}{\begin{tabular}{l} Capital expenditures \\ % of Sales \end{tabular}} \\ \hline Dividends & % of Net income, use hist avg & 613,439 & 828,452 & \\ \hline% of NI & & & & \\ \hline & & & & Projected \\ \hline & & & & 2023 \\ \hline operating activities & & & & \\ \hline Net income & & & & \\ \hline Depreciation & & & & \\ \hline Changes in operating assets and liabilitie & & & & \\ \hline Accounts receivable, net & & & & \\ \hline Inventory & & & & \\ \hline Other current assets & & & & \\ \hline & & & & \\ \hline \begin{tabular}{l} Account pataboble \\ Other current liabilities \end{tabular} & & & & \\ \hline Net cash provided by operating activities & & & & \\ \hline Investing activities & & & & \\ \hline \begin{tabular}{l} Investing activities \\ Purchases of property and equipment \end{tabular} & & & & \\ \hline Net cash used in investing activities & & & & \\ \hline \end{tabular} You have been asked to prepare a 1-year financial statement forecast model for Biggco. The 'Forecast model' worksheet contains a model template with the historical income statement and balance sheet for the last two years, as well as a set of assumptions to be used to generate a forecast for next year (2023). Follow the instructions below in order to complete the forecast model. 1) Replace the hardcoded subtotals and totals in the historical income statement and balance sheet with a calculation. This step will help you become familiar with the structure of the financial statements and ensure that forecasted subtotals/totals are calculated properly. As you complete this step, make sure your subtotal/total calculations match the original hardcoded value. 2) Using the forecasting assumptions provided on the Model tab, complete the income statement and balance sheet by filling in the appropriate calculations for each line item in the income statement, balance sheet. 3) Build the statement of cash flows for 2023 based on your forecast income statement and balance sheet
 Step by Step Solution
There are 3 Steps involved in it
Step: 1

Get Instant Access to Expert-Tailored Solutions
See step-by-step solutions with expert insights and AI powered tools for academic success
Step: 2

Step: 3

Ace Your Homework with AI
Get the answers you need in no time with our AI-driven, step-by-step assistance
Get Started


