Answered step by step
Verified Expert Solution
Link Copied!

Question

1 Approved Answer

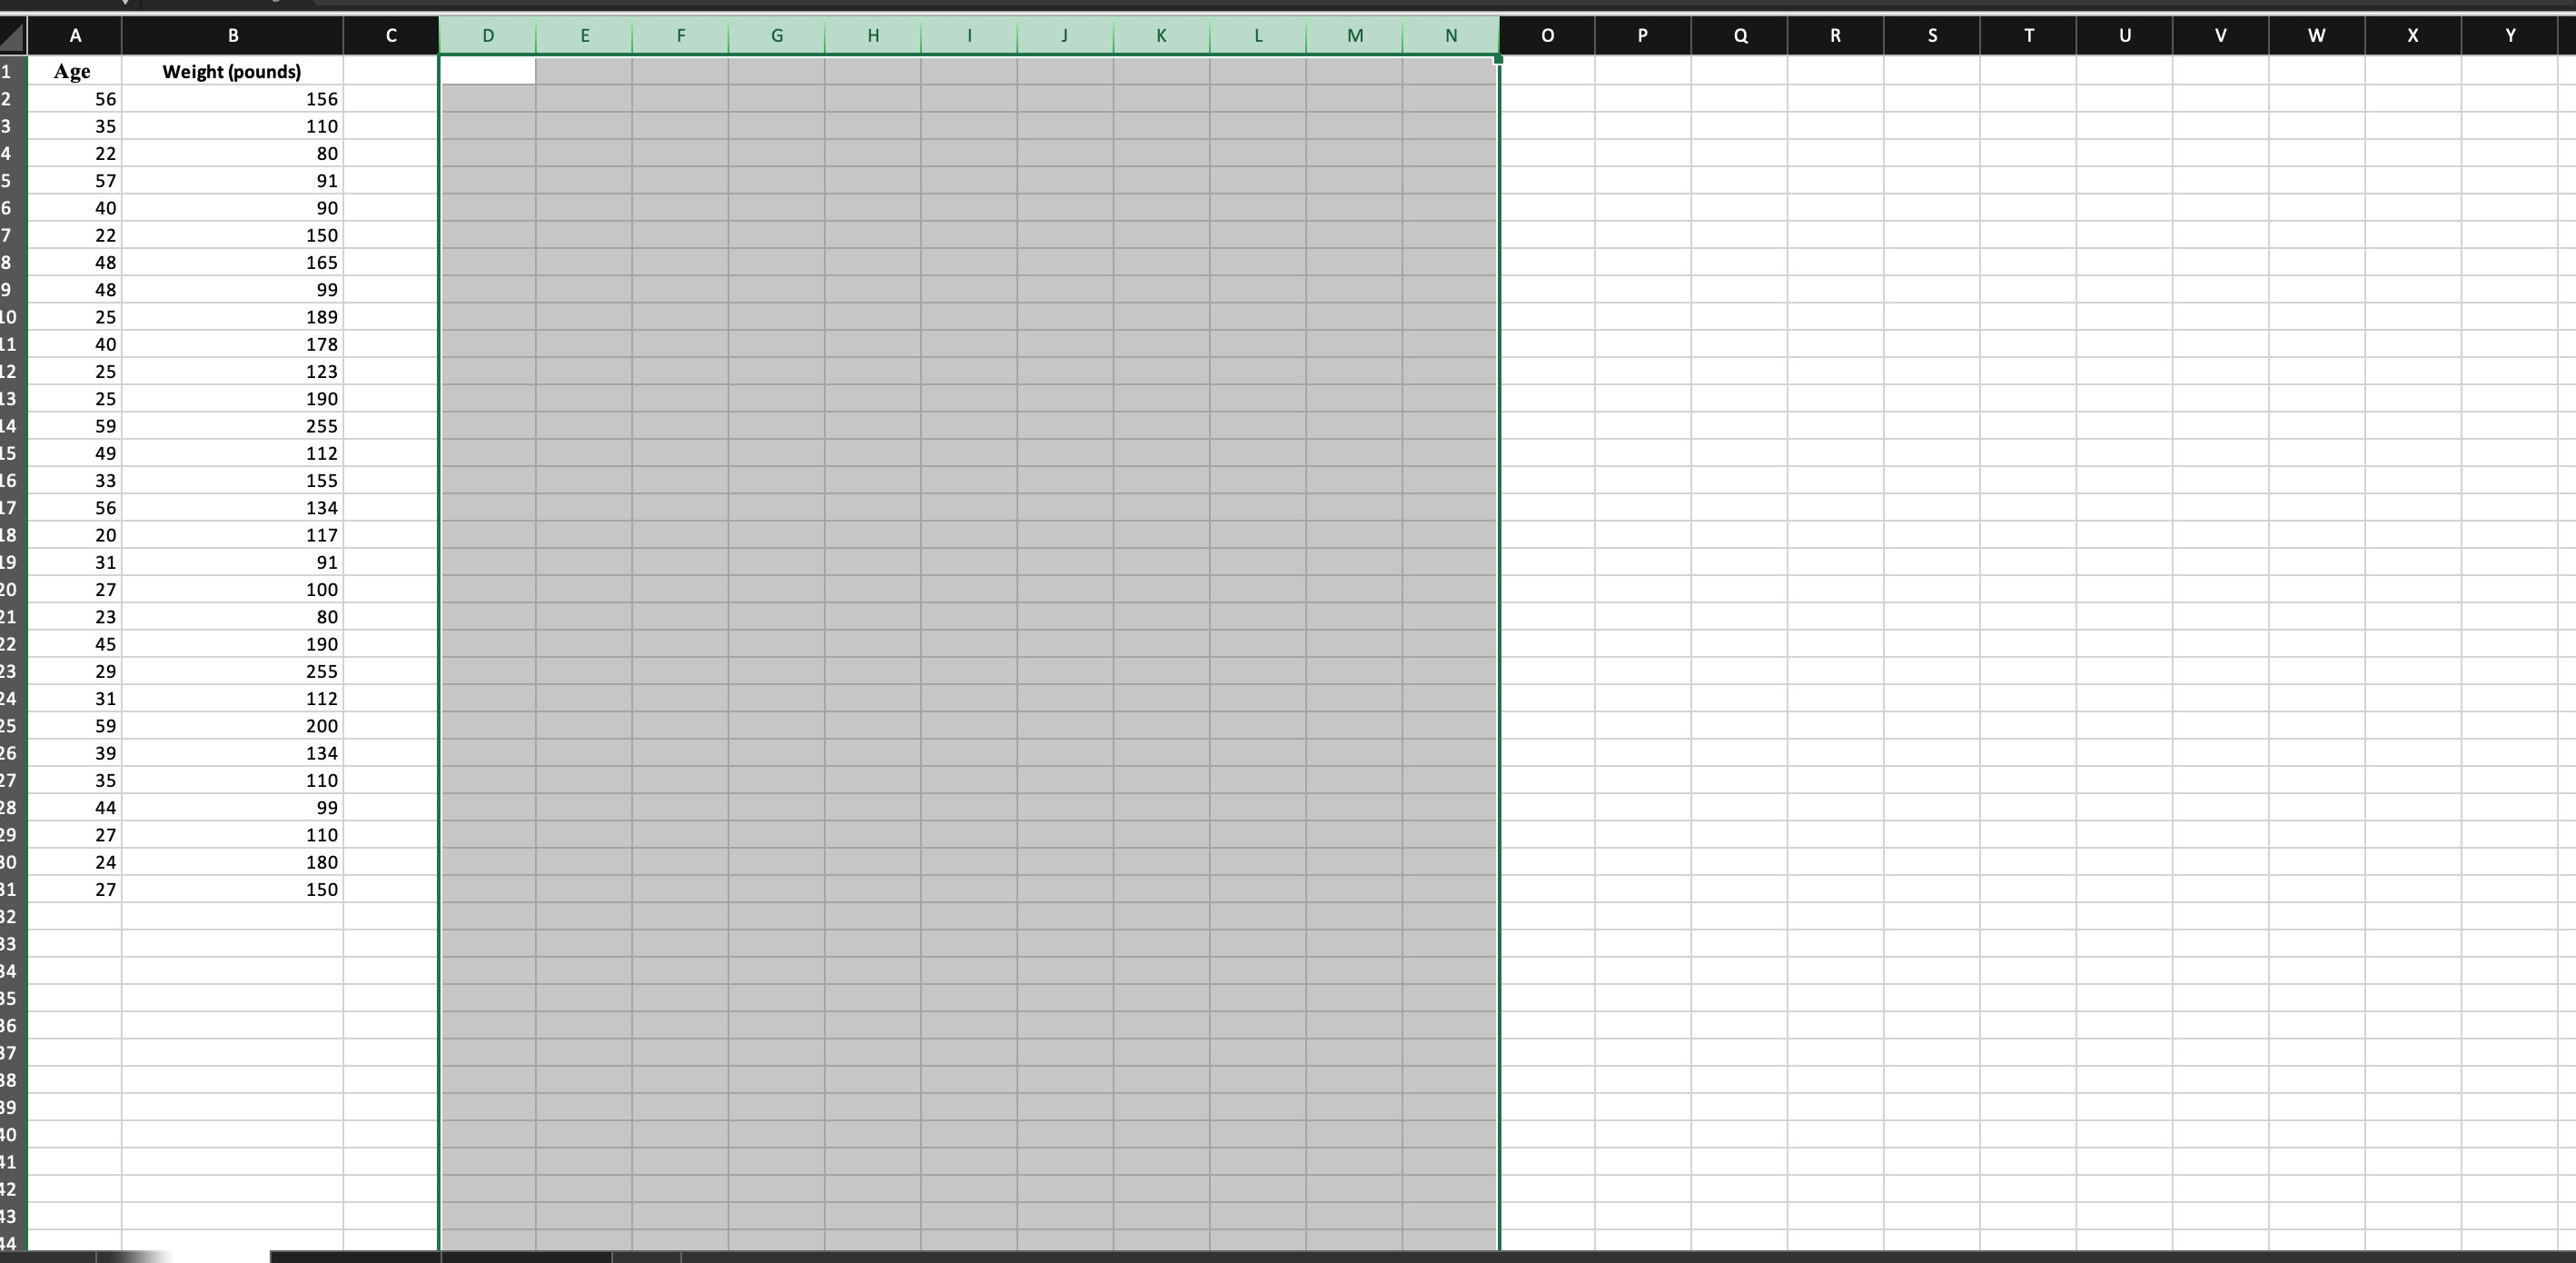
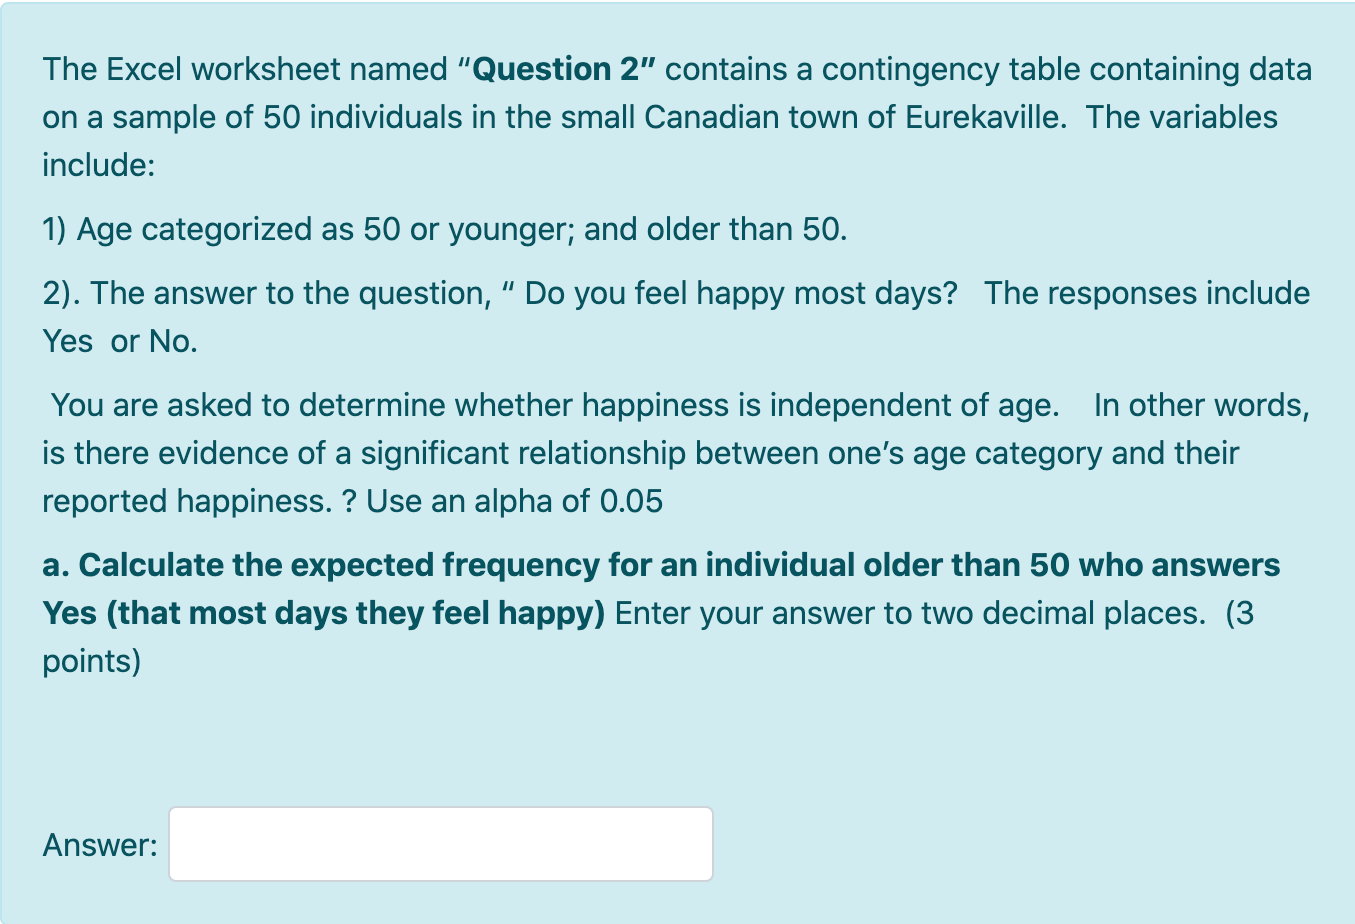
need help fThe Excel worksheet named Question 2 contains a contingency table containing data on a sample of 50 individuals in the small Canadian town

need help

image text in transcribedimage text in transcribed
\fThe Excel worksheet named "Question 2" contains a contingency table containing data on a sample of 50 individuals in the small Canadian town of Eurekaville. The variables include: 1) Age categorized as 50 or younger; and older than 50. 2). The answer to the question, " Do you feel happy most days? The responses include Yes or No. You are asked to determine whether happiness is independent of age. In other words, is there evidence of a significant relationship between one's age category and their reported happiness. ? Use an alpha of 0.05 a. Calculate the expected frequency for an individual older than 50 who answers Yes (that most days they feel happy) Enter your answer to two decimal places. (3 points)

Step by Step Solution

There are 3 Steps involved in it

Step: 1

blur-text-image

Get Instant Access to Expert-Tailored Solutions

See step-by-step solutions with expert insights and AI powered tools for academic success

Step: 2

blur-text-image

Step: 3

blur-text-image

Ace Your Homework with AI

Get the answers you need in no time with our AI-driven, step-by-step assistance

Get Started

Recommended Textbook for

College Algebra

Authors: Margaret L. Lial, John Hornsby, David I. Schneider, Callie Daniels

12th edition

134697022, 9780134313795 , 978-0134697024

More Books

Students also viewed these Mathematics questions