Need help solving 3-6:
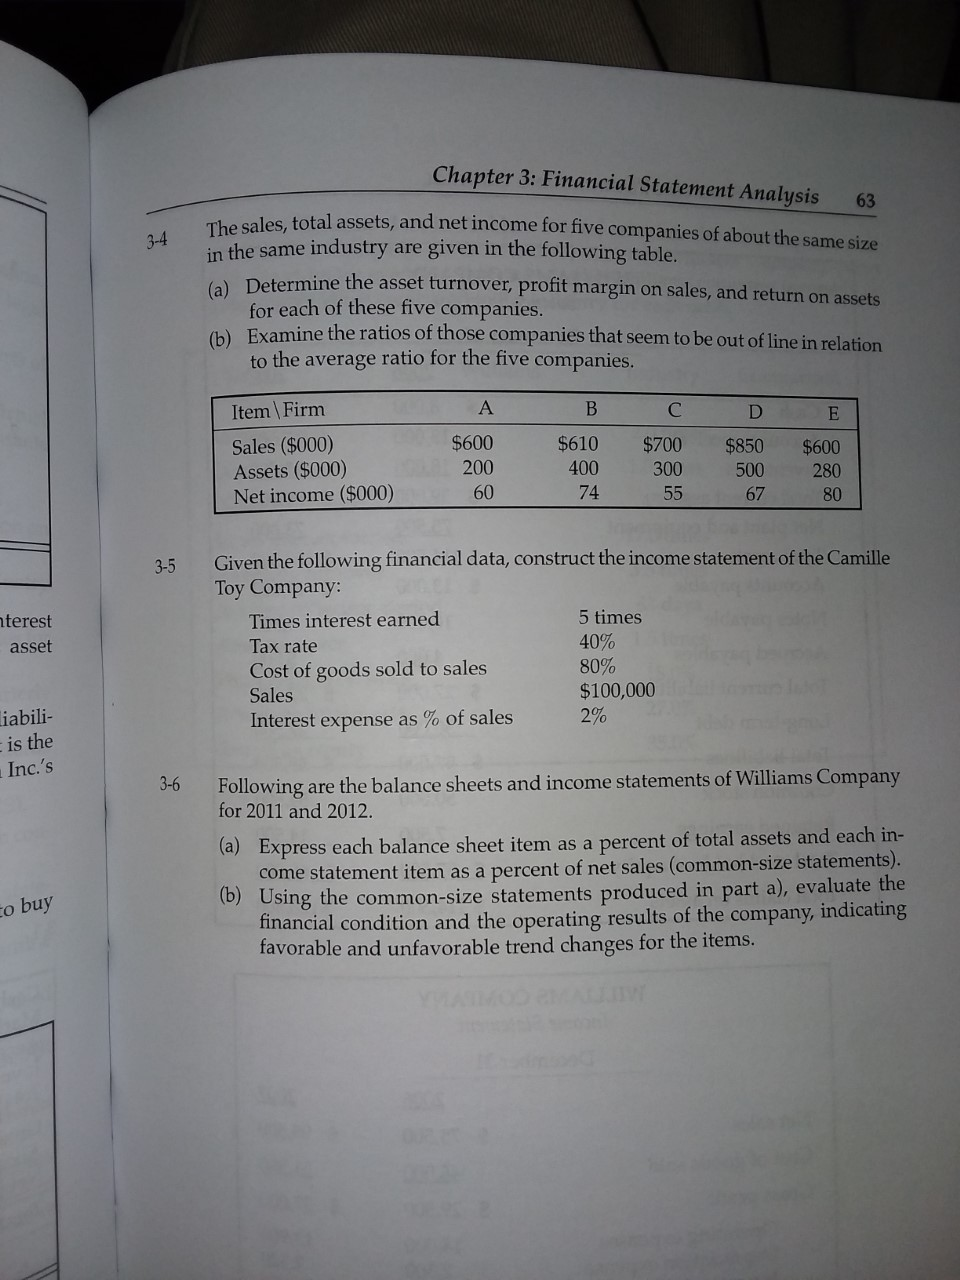
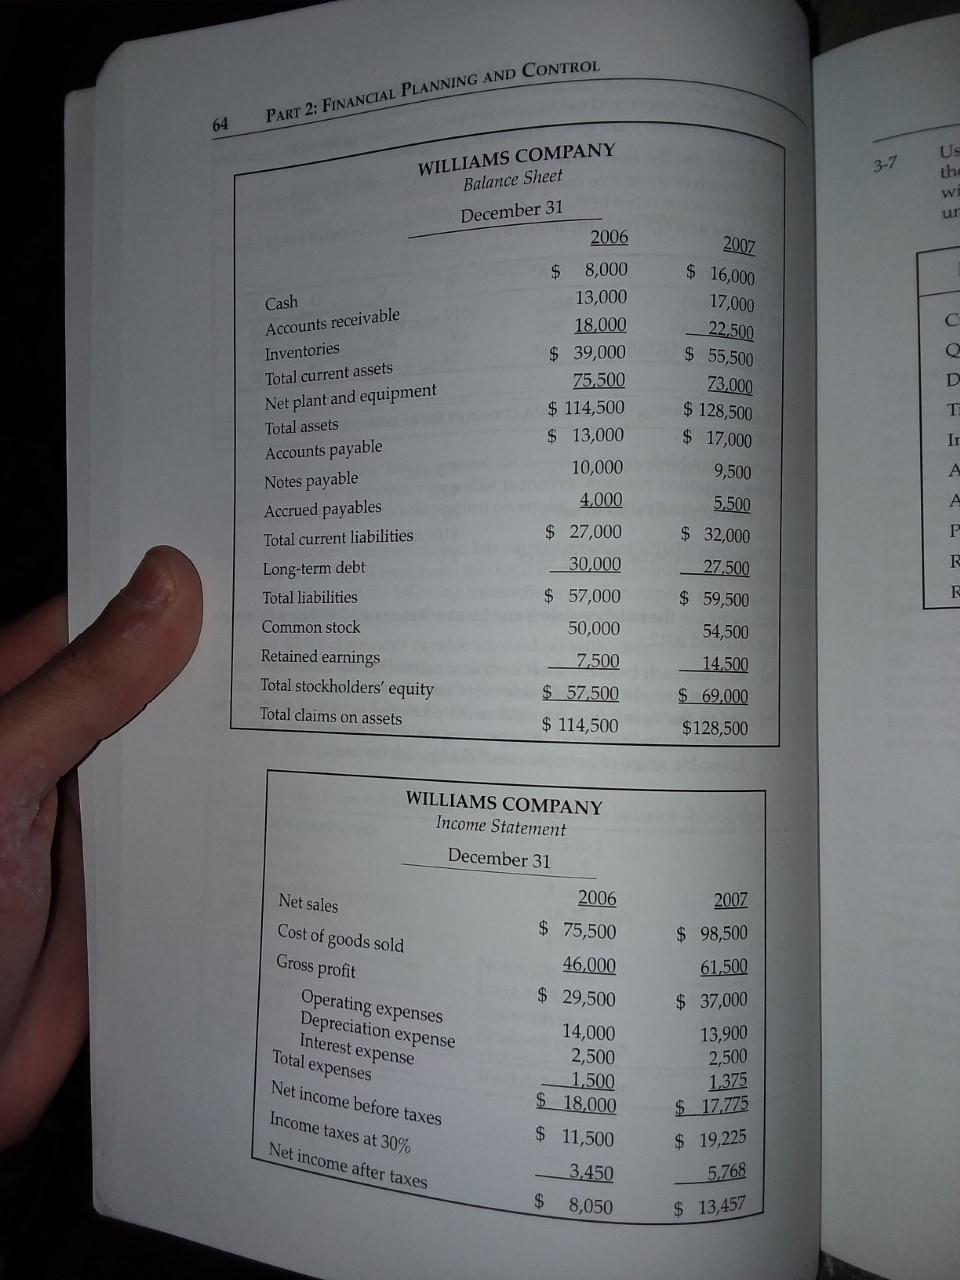
Chapter 3: Financial Statement Analysis 63 3-4 The sales, total assets, and net income in the same industry are given in the following table. Determine the asset turnover, profit margin on sales, and return on assets for each of these five companies. th) Examine the ratios of those companies that seem to be out of line in polet to the average ratio for the five companies. Item \Firm a n Sales ($000) Assets ($000) Net income ($000) A $600 200 60 B $610 400 74 C $700 300 55 D $850 500 67 E $600 280 80 3-5 nterest asset Given the following financial data, construct the income statement of the Camille Toy Company: Times interest earned 5 times Tax rate 40% Cost of goods sold to sales 80% Sales $100,000 Interest expense as % of sales 2% liabili- is the - Inc.'s 3-6 Following are the balance sheets and income statements of Williams Company for 2011 and 2012. co buy a) Express each balance sheet item as a percent of total assets and each in- come statement item as a percent of net sales (common-size statements). 1) Using the common-size statements produced in part a), evaluate the financial condition and the operating results of the company, indicating favorable and unfavorable trend changes for the items. PART 2: FINANCIAL PLANNING AND CONTROL 64 Us 3-7 WILLIAMS COMPANY Balance Sheet December 31 th wi Cash 2007 $ 16,000 17,000 22,500 $ 55,500 Accounts receivable Inventories Total current assets Net plant and equipment Total assets Accounts payable Notes payable Accrued payables Total current liabilities Long-term debt 2006 $ 8,000 13,000 18.000 $ 39,000 75,500 $ 114,500 $ 13,000 10,000 4,000 $ 27,000 30,000 $ 57,000 50,000 7,500 $ 57,500 $ 114,500 73,000 $ 128,500 $ 17,000 9,500 5,500 $ 32,000 27,500 $ 59,500 54,500 14,500 $ 69,000 $ 128,500 Total liabilities Common stock Retained earnings Total stockholders' equity Total claims on assets WILLIAMS COMPANY Income Statement December 31 Net sales Cost of goods sold Gross profit 2006 $ 75,500 46,000 $ 29,500 14,000 2,500 1,500 $ 18,000 $ 11,500 3.450 2007 $ 98,500 61,500 $ 37,000 13,900 2,500 Operating expenses Depreciation expense Interest expense Total expenses Net income before taxes Income taxes at 30% Net income after taxes 1.375 $ 17.775 $ 19,225 5.768 $ 13,457 $ 8,050 Chapter 3: Financial Statement Analysis 63 3-4 The sales, total assets, and net income in the same industry are given in the following table. Determine the asset turnover, profit margin on sales, and return on assets for each of these five companies. th) Examine the ratios of those companies that seem to be out of line in polet to the average ratio for the five companies. Item \Firm a n Sales ($000) Assets ($000) Net income ($000) A $600 200 60 B $610 400 74 C $700 300 55 D $850 500 67 E $600 280 80 3-5 nterest asset Given the following financial data, construct the income statement of the Camille Toy Company: Times interest earned 5 times Tax rate 40% Cost of goods sold to sales 80% Sales $100,000 Interest expense as % of sales 2% liabili- is the - Inc.'s 3-6 Following are the balance sheets and income statements of Williams Company for 2011 and 2012. co buy a) Express each balance sheet item as a percent of total assets and each in- come statement item as a percent of net sales (common-size statements). 1) Using the common-size statements produced in part a), evaluate the financial condition and the operating results of the company, indicating favorable and unfavorable trend changes for the items. PART 2: FINANCIAL PLANNING AND CONTROL 64 Us 3-7 WILLIAMS COMPANY Balance Sheet December 31 th wi Cash 2007 $ 16,000 17,000 22,500 $ 55,500 Accounts receivable Inventories Total current assets Net plant and equipment Total assets Accounts payable Notes payable Accrued payables Total current liabilities Long-term debt 2006 $ 8,000 13,000 18.000 $ 39,000 75,500 $ 114,500 $ 13,000 10,000 4,000 $ 27,000 30,000 $ 57,000 50,000 7,500 $ 57,500 $ 114,500 73,000 $ 128,500 $ 17,000 9,500 5,500 $ 32,000 27,500 $ 59,500 54,500 14,500 $ 69,000 $ 128,500 Total liabilities Common stock Retained earnings Total stockholders' equity Total claims on assets WILLIAMS COMPANY Income Statement December 31 Net sales Cost of goods sold Gross profit 2006 $ 75,500 46,000 $ 29,500 14,000 2,500 1,500 $ 18,000 $ 11,500 3.450 2007 $ 98,500 61,500 $ 37,000 13,900 2,500 Operating expenses Depreciation expense Interest expense Total expenses Net income before taxes Income taxes at 30% Net income after taxes 1.375 $ 17.775 $ 19,225 5.768 $ 13,457 $ 8,050