

Answered step by step
Verified Expert Solution
Question
1 Approved Answer
need help. will thumbs up! Using Microsoft Excel, make a calibration curve for the data below. Include vertical error bars (indicating a 95% confidence interval)
need help. will thumbs up! 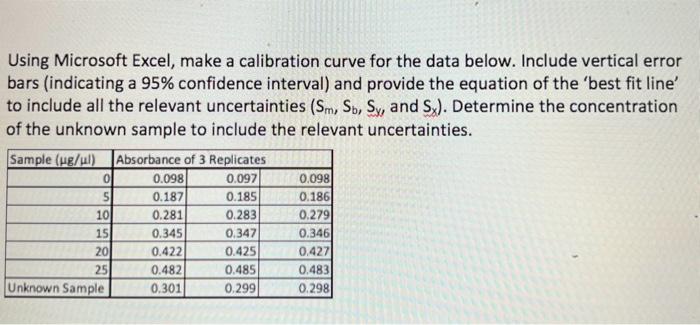
Using Microsoft Excel, make a calibration curve for the data below. Include vertical error bars (indicating a 95\% confidence interval) and provide the equation of the 'best fit line' to include all the relevant uncertainties (Sm,Sb,Sy and Sx). Determine the concentration of the unknown sample to include the relevant uncertainties Step by Step Solution
There are 3 Steps involved in it
Step: 1

Get Instant Access to Expert-Tailored Solutions
See step-by-step solutions with expert insights and AI powered tools for academic success
Step: 2

Step: 3
Ace Your Homework with AI
Get the answers you need in no time with our AI-driven, step-by-step assistance
Get Started
Mastering Big Data Interview 751 Comprehensive Questions And Expert Answers
Authors: Mr Bhanu Pratap Mahato
1st Edition
B0CLNT3NVD, 979-8865047216