Answered step by step
Verified Expert Solution
Link Copied!

Question

1 Approved Answer

Need help with correct option Use the figure below to answer the j X Price level (GDP deflator, 2007 - 100) LAS 130 120 SAS

Need help with correct option
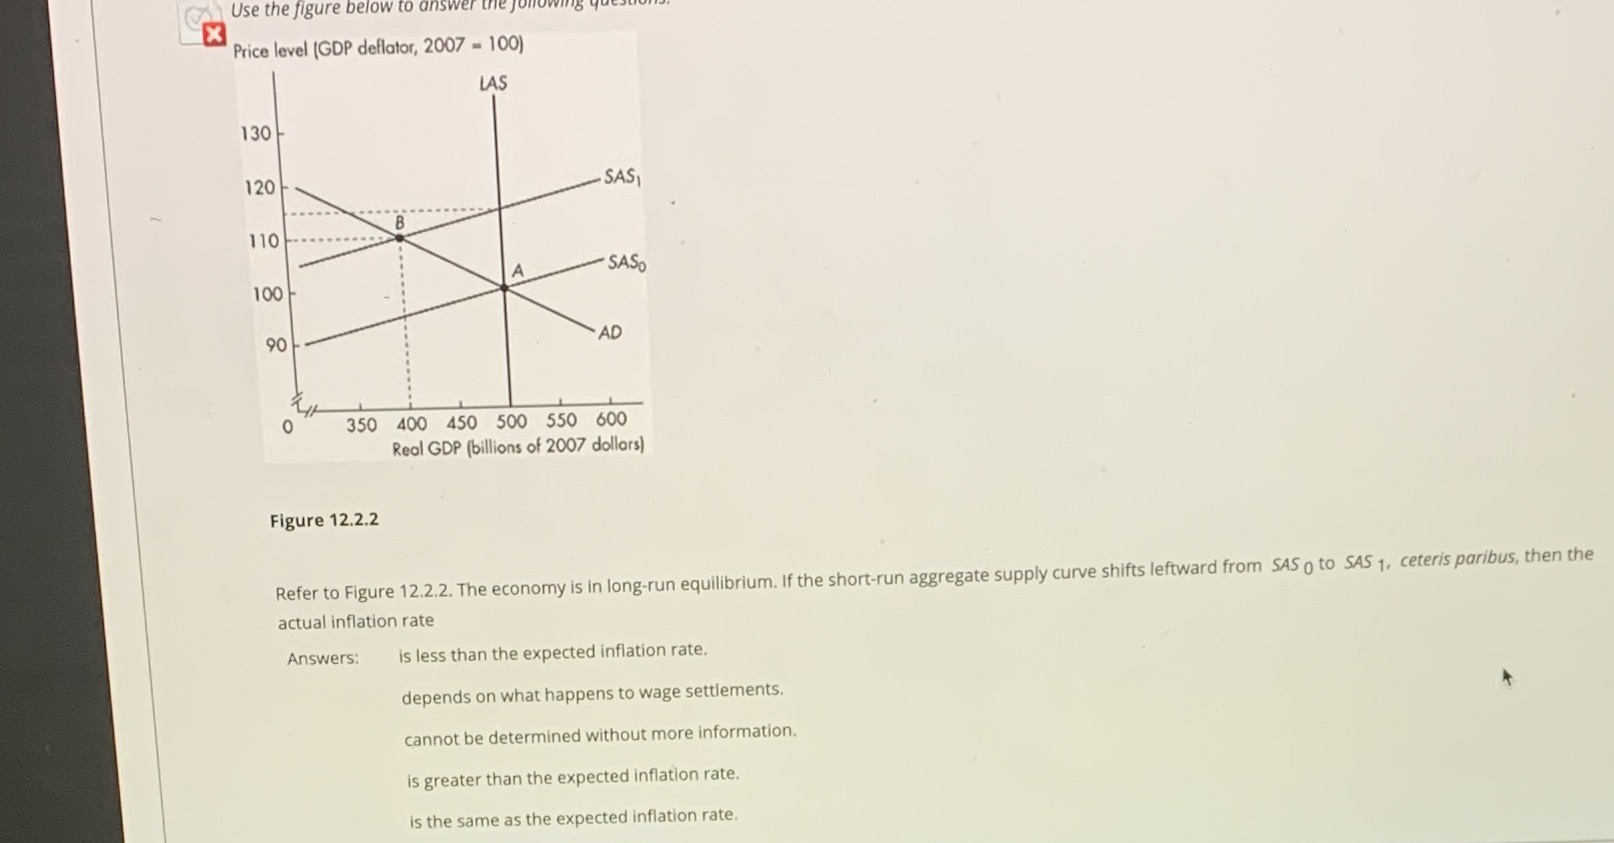
image text in transcribed
Use the figure below to answer the j X Price level (GDP deflator, 2007 - 100) LAS 130 120 SAS B 110 - SASO 100 90 AD 0 350 400 450 500 550 600 Real GDP (billions of 2007 dollars) Figure 12.2.2 Refer to Figure 12.2.2. The economy is in long-run equilibrium. If the short-run aggregate supply curve shifts leftward from SAS o to SAS 1, ceteris paribus, then the actual inflation rate Answers: is less than the expected inflation rate. depends on what happens to wage settlements. cannot be determined without more information. is greater than the expected inflation rate. is the same as the expected inflation rate

Step by Step Solution

There are 3 Steps involved in it

Step: 1

blur-text-image

Get Instant Access to Expert-Tailored Solutions

See step-by-step solutions with expert insights and AI powered tools for academic success

Step: 2

blur-text-image

Step: 3

blur-text-image

Ace Your Homework with AI

Get the answers you need in no time with our AI-driven, step-by-step assistance

Get Started

Recommended Textbook for

Econometric Analysis

Authors: William H. Greene

5th Edition

130661899, 978-0130661890

More Books

Students also viewed these Economics questions

Question

LO40.4 Analyze the economic effects of tariffs and quotas.

Answered: 1 week ago