Need help with MATLAB programming
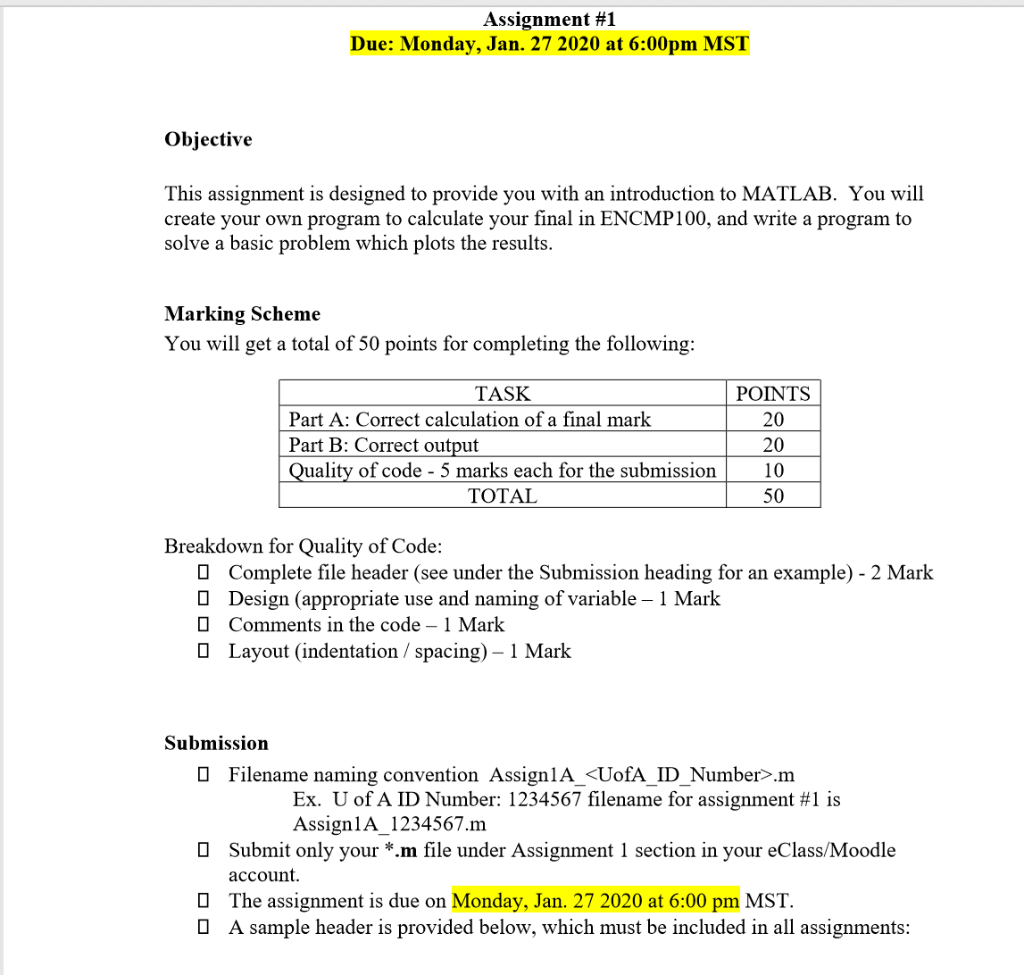
Assignment #1 Due: Monday, Jan. 27 2020 at 6:00pm MST Objective This assignment is designed to provide you with an introduction to MATLAB. You will create your own program to calculate your final in ENCMP100, and write a program to solve a basic problem which plots the results. Marking Scheme You will get a total of 50 points for completing the following: TASK POINTS Part A: Correct calculation of a final mark Part B: Correct output Quality of code - 5 marks each for the submission 20 20 10 TOTAL 50 Breakdown for Quality of Code: O Complete file header (see under the Submission heading for an example) - 2 Mark O Design (appropriate use and naming of variable 1 Mark O Comments in the code 1 Mark O Layout (indentation / spacing) 1 Mark Submission O Filename naming convention Assign1A_
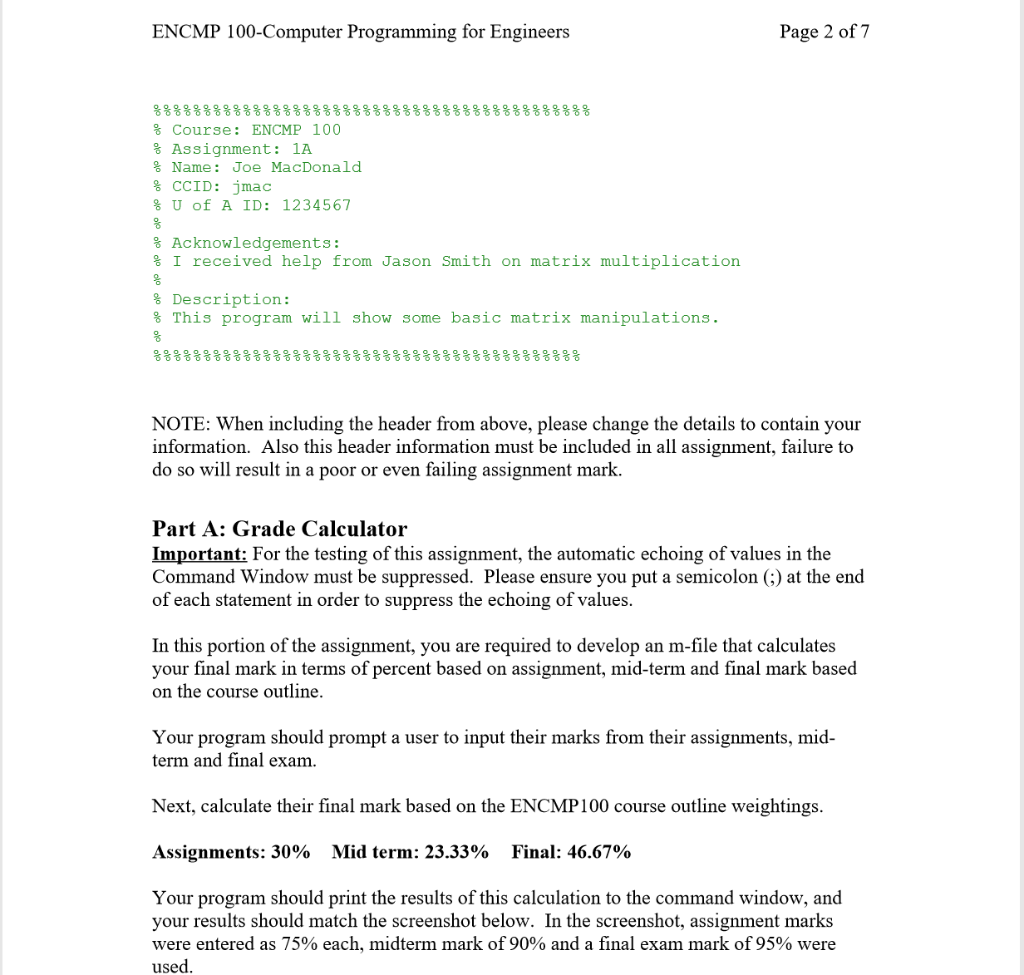
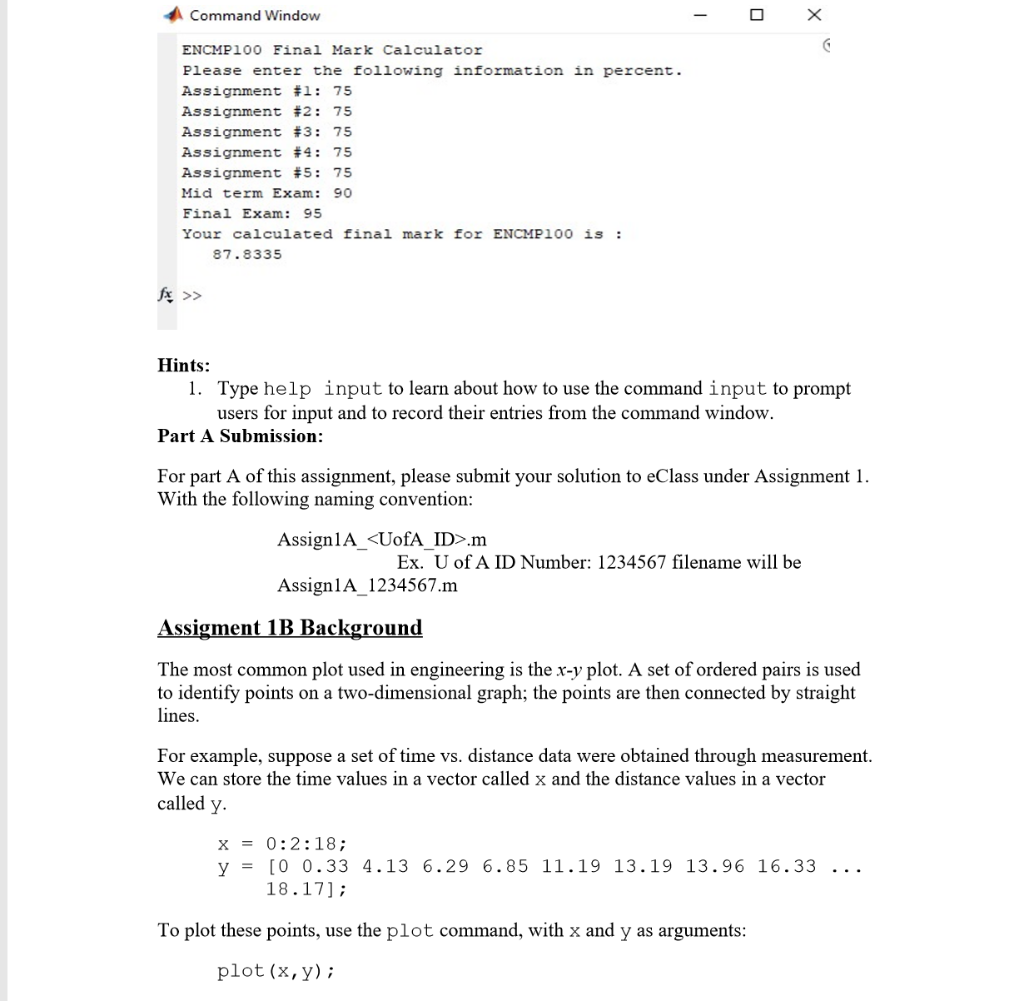
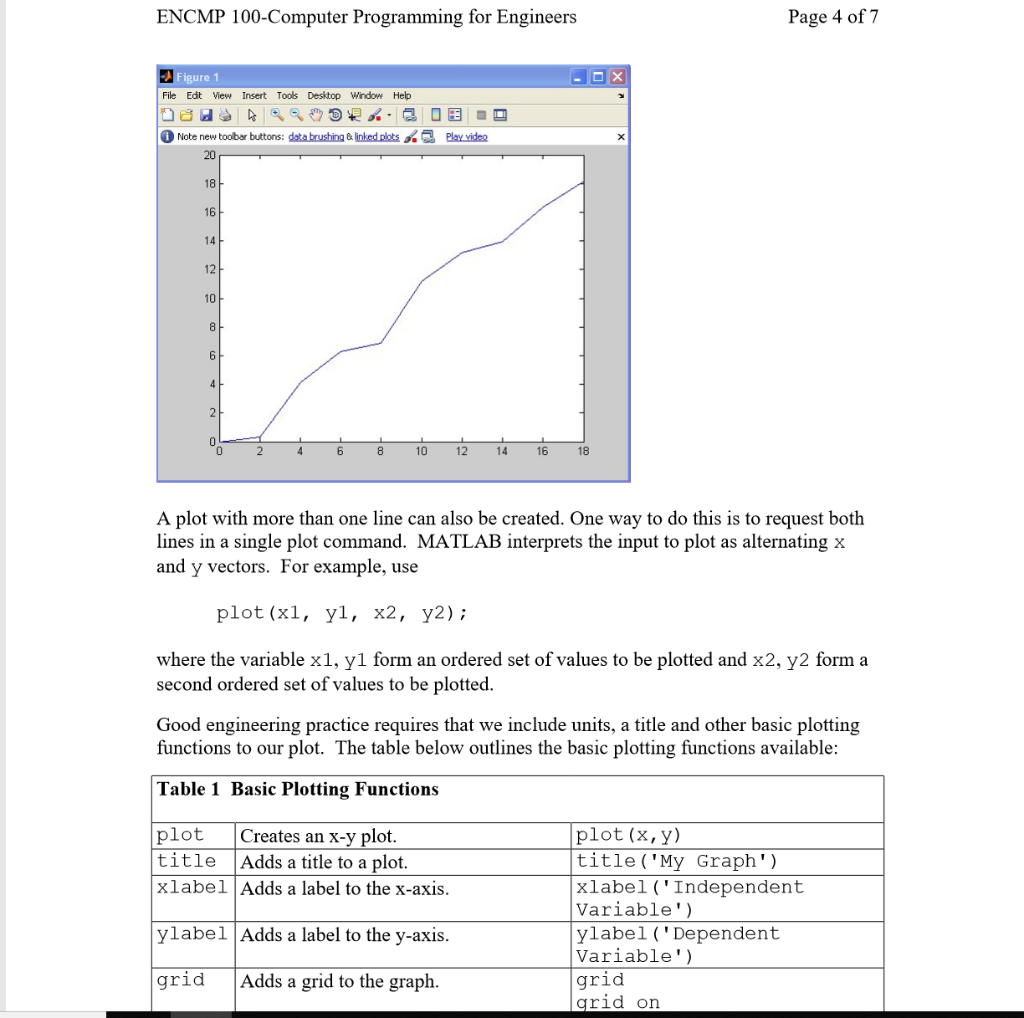
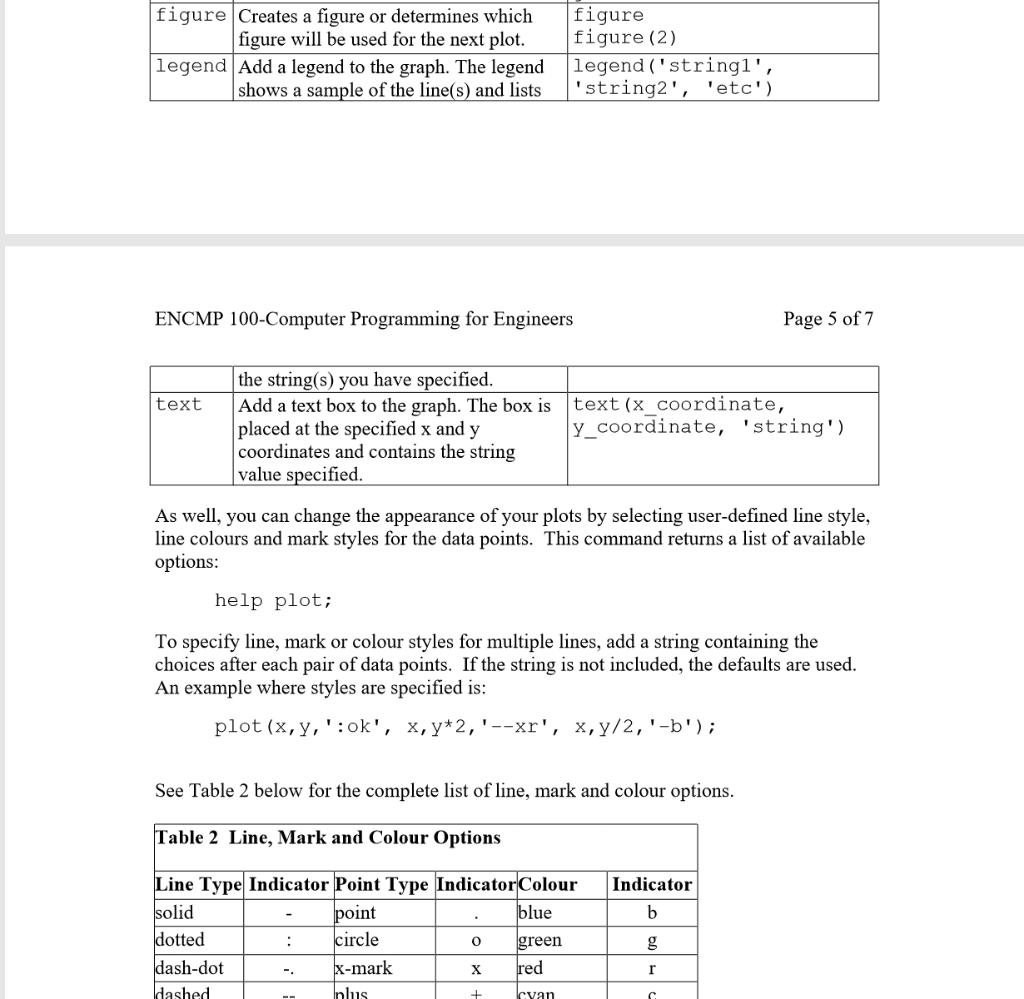
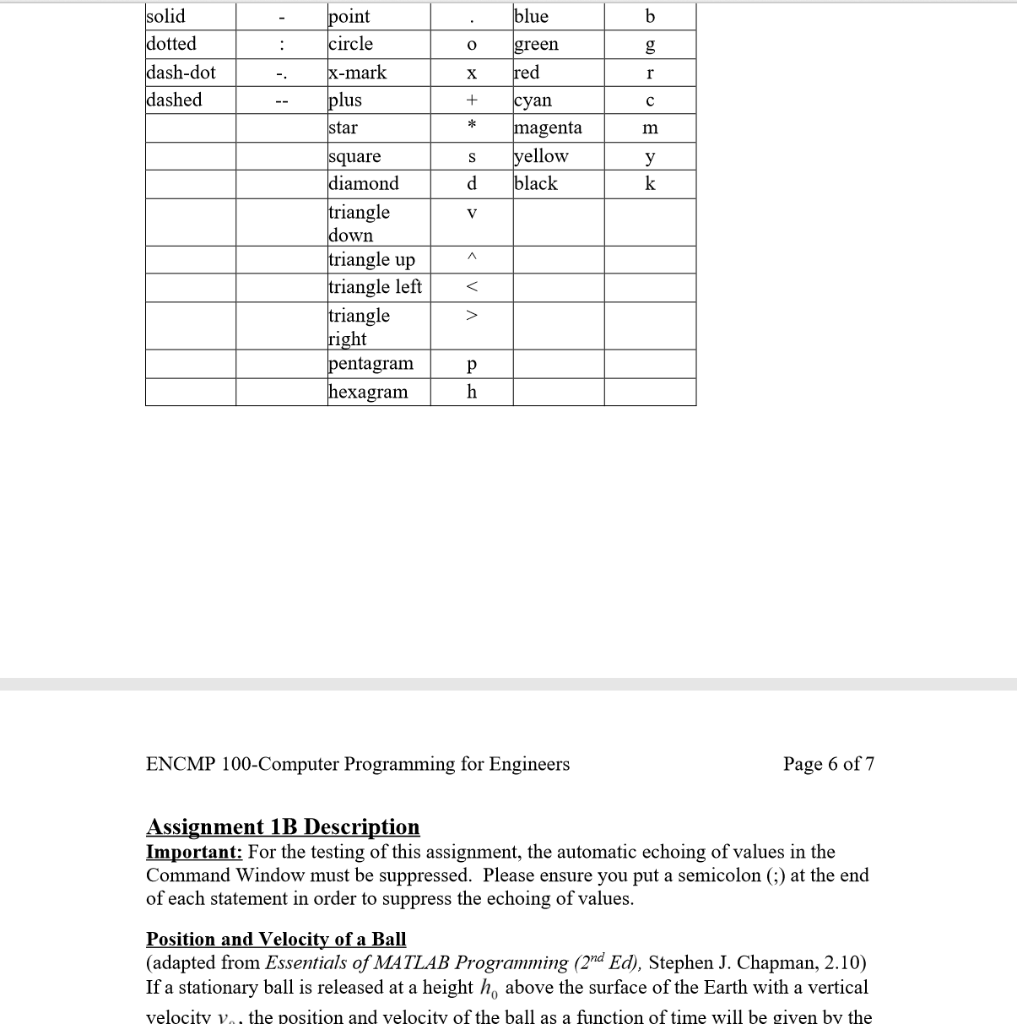
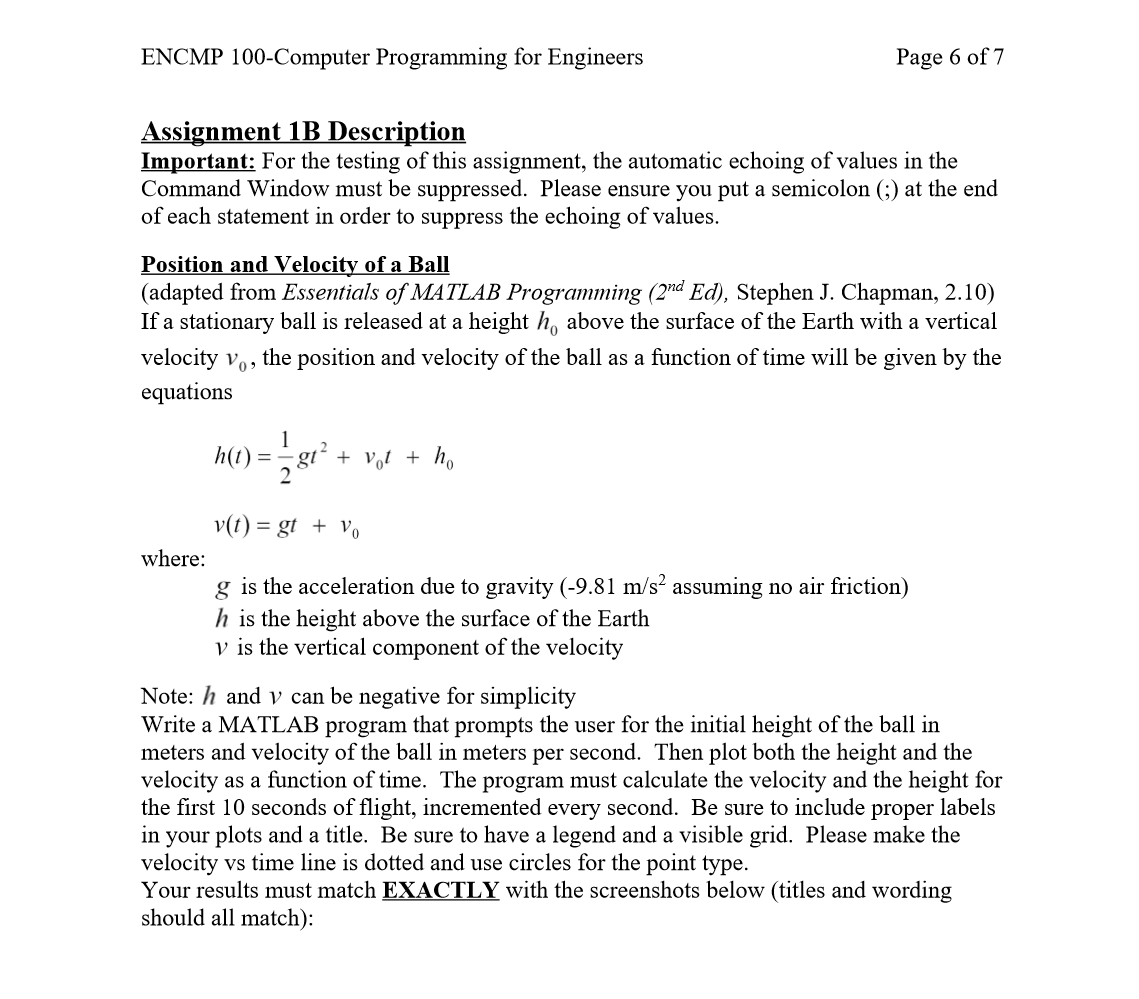
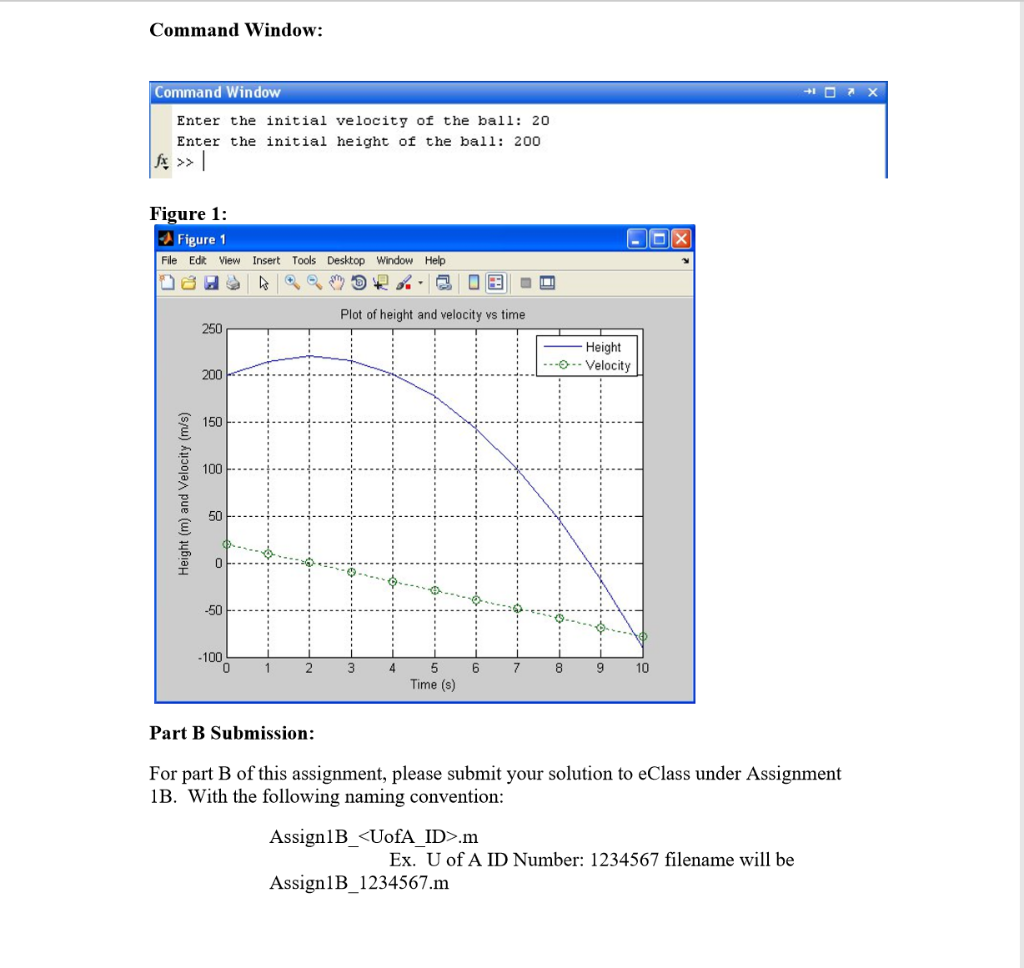
.m Ex. U of A ID Number: 1234567 filename for assignment #1 is Assign1A_1234567.m O Submit only your *.m file under Assignment 1 section in your eClass/Moodle account. O The assignment is due on Monday, Jan. 27 2020 at 6:00 pm MST. O A sample header is provided below, which must be included in all assignments: ENCMP 100-Computer Programming for Engineers Page 2 of 7 % Course: ENCMP 100 % Assignment: 1A % Name: Joe MacDonald % CCID: jmac % U of A ID: 1234567 % Acknowledgements: % I received help from Jason Smith on matrix multiplication % Description: % This program will show some basic matrix manipulations. NOTE: When including the header from above, please change the details to contain your information. Also this header information must be included in all assignment, failure to do so will result in a poor or even failing assignment mark. Part A: Grade Calculator Important: For the testing of this assignment, the automatic echoing of values in the Command Window must be suppressed. Please ensure you put a semicolon (;) at the end of each statement in order to suppress the echoing of values. In this portion of the assignment, you are required to develop an m-file that calculates your final mark in terms of percent based on assignment, mid-term and final mark based on the course outline. Your program should prompt a user to input their marks from their assignments, mid- term and final exam. Next, calculate their final mark based on the ENCMP100 course outline weightings. Final: 46.67% Assignments: 30% Mid term: 23.33% Your program should print the results of this calculation to the command window, and your results should match the screenshot below. In the screenshot, assignment marks were entered as 75% each, midterm mark of 90% and a final exam mark of 95% were used. Command Window ENCMP100 Final Mark Calculator Please enter the following information in percent. Assignment #1: 75 Assignment #2: 75 Assignment #3: 75 Assignment #4: 75 Assignment #5: 75 Mid term Exam: 90 Final Exam: 95 Your calculated final mark for ENCMP100 is : 87.8335 fx >> Hints: 1. Type help input to learn about how to use the command input to prompt users for input and to record their entries from the command window. Part A Submission: For part A of this assignment, please submit your solution to eClass under Assignment 1. With the following naming convention: Assign1A_.m Ex. U of A ID Number: 1234567 filename will be Assign1A_1234567.m Assigment 1B Background The most common plot used in engineering is the x-y plot. A set of ordered pairs is used to identify points on a two-dimensional graph; the points are then connected by straight lines. For example, suppose a set of time vs. distance data were obtained through measurement. We can store the time values in a vector called x and the distance values in a vector called y. x = 0:2:18; y = [0 0.33 4.13 6.29 6.85 11.19 13.19 13.96 16.33 18.17]; To plot these points, use the plot command, with x and y as arguments: plot (x,y); Page 4 of 7 ENCMP 100-Computer Programming for Engineers Figure 1 File Edt View Insert Tools Desktop Window Help O Note new toolbar buttons: data brushing & linked plots 3 Play video 20 18 16 14 12 10 12 10 16 18 14 A plot with more than one line can also be created. One way to do this is to request both lines in a single plot command. MATLAB interprets the input to plot as alternating x and y vectors. For example, use plot (x1, y1, 2, 2); where the variable x1, yl form an ordered set of values to be plotted and x2, y2 form a second ordered set of values to be plotted. Good engineering practice requires that we include units, a title and other basic plotting functions to our plot. The table below outlines the basic plotting functions available: Table 1 Basic Plotting Functions plot (x,y) title('My Graph') plot Creates an x-y plot. |Adds a title to a plot. xlabel Adds a label to the x-axis. title xlabel('Independent Variable') ylabel ('Dependent Variable') grid grid on ylabel Adds a label to the y-axis. Adds a grid to the graph. grid figure figure (2) legend ('string1', 'string2', 'etc') figure Creates a figure or determines which figure will be used for the next plot. legend Add a legend to the graph. The legend shows a sample of the line(s) and lists ENCMP 100-Computer Programming for Engineers Page 5 of 7 the string(s) you have specified. Add a text box to the graph. The box is placed at the specified x and y coordinates and contains the string value specified. text(x coordinate, y_coordinate, 'string') text As well, you can change the appearance of your plots by selecting user-defined line style, line colours and mark styles for the data points. This command returns a list of available options: help plot; To specify line, mark or colour styles for multiple lines, add a string containing the choices after each pair of data points. If the string is not included, the defaults are used. An example where styles are specified is: plot (x,y,':ok', x,y*2,' --xr', x,y/2,'-b'); See Table 2 below for the complete list of line, mark and colour options. Table 2 Line, Mark and Colour Options Line Type Indicator Point Type IndicatorColour solid dotted dash-dot dashed Indicator point circle blue green x-mark red -. plus cvan solid dotted point circle X-mark plus blue green : dash-dot dashed red -. cyan magenta yellow black star m square diamond triangle down triangle up triangle left triangle right pentagram hexagram y d. h ENCMP 100-Computer Programming for Engineers Page 6 of 7 Assignment 1B Description Important: For the testing of this assignment, the automatic echoing of values in the Command Win must be suppressed. of each statement in order to suppress the echoing of values. ease ensure you put a semicolon (;) at the end Position and Velocity of a Ball (adapted from Essentials of MATLAB Programming (2nd Ed), Stephen J. Chapman, 2.10) If a stationary ball is released at a height h, above the surface of the Earth with a vertical velocity v., the position and velocity of the ball as a function of time will be given by the ENCMP 100-Computer Programming for Engineers Page 6 of 7 Assignment 1B Description Important: For the testing of this assignment, the automatic echoing of values in the Command Window must be suppressed. Please ensure you put a semicolon (;) at the end of each statement in order to suppress the echoing of values. Position and Velocity of a Ball (adapted from Essentials of MATLAB Programming (2nd Ed), Stephen J. Chapman, 2.10) If a stationary ball is released at a height h, above the surface of the Earth with a vertical velocity vo, the position and velocity of the ball as a function of time will be given by the equations h(t) = - gt' + v,t + ho v(t) = gt + Vo where: g is the acceleration due to gravity (-9.81 m/s? assuming no air friction) h is the height above the surface of the Earth v is the vertical component of the velocity Note: h and v can be negative for simplicity Write a MATLAB program that prompts the user for the initial height of the ball in meters and velocity of the ball in meters per second. Then plot both the height and the velocity as a function of time. The program must calculate the velocity and the height for the first 10 seconds of flight, incremented every second. Be sure to include proper labels in your plots and a title. Be sure to have a legend and a visible grid. Please make the velocity vs time line is dotted and use circles for the point type. Your results must match EXACTLY with the screenshots below (titles and wording should all match): Command Window: Command Window Enter the initial velocity of the ball: 20 Enter the initial height of the ball: 200 Figure 1: A Figure 1 File Edit View Insert Tools Desktop Window Help Plot of height and velocity vs time 250 Height -O-- Velocity 200 150 100 -50 -100 4 10 Time (s) Part B Submission: For part B of this assignment, please submit your solution to eClass under Assignment 1B. With the following naming convention: Assign1B_.m Ex. U of A ID Number: 1234567 filename will be Assign1B_1234567.m Height (m) and Velocity (m/s)


