Answered step by step
Verified Expert Solution
Link Copied!

Question

1 Approved Answer

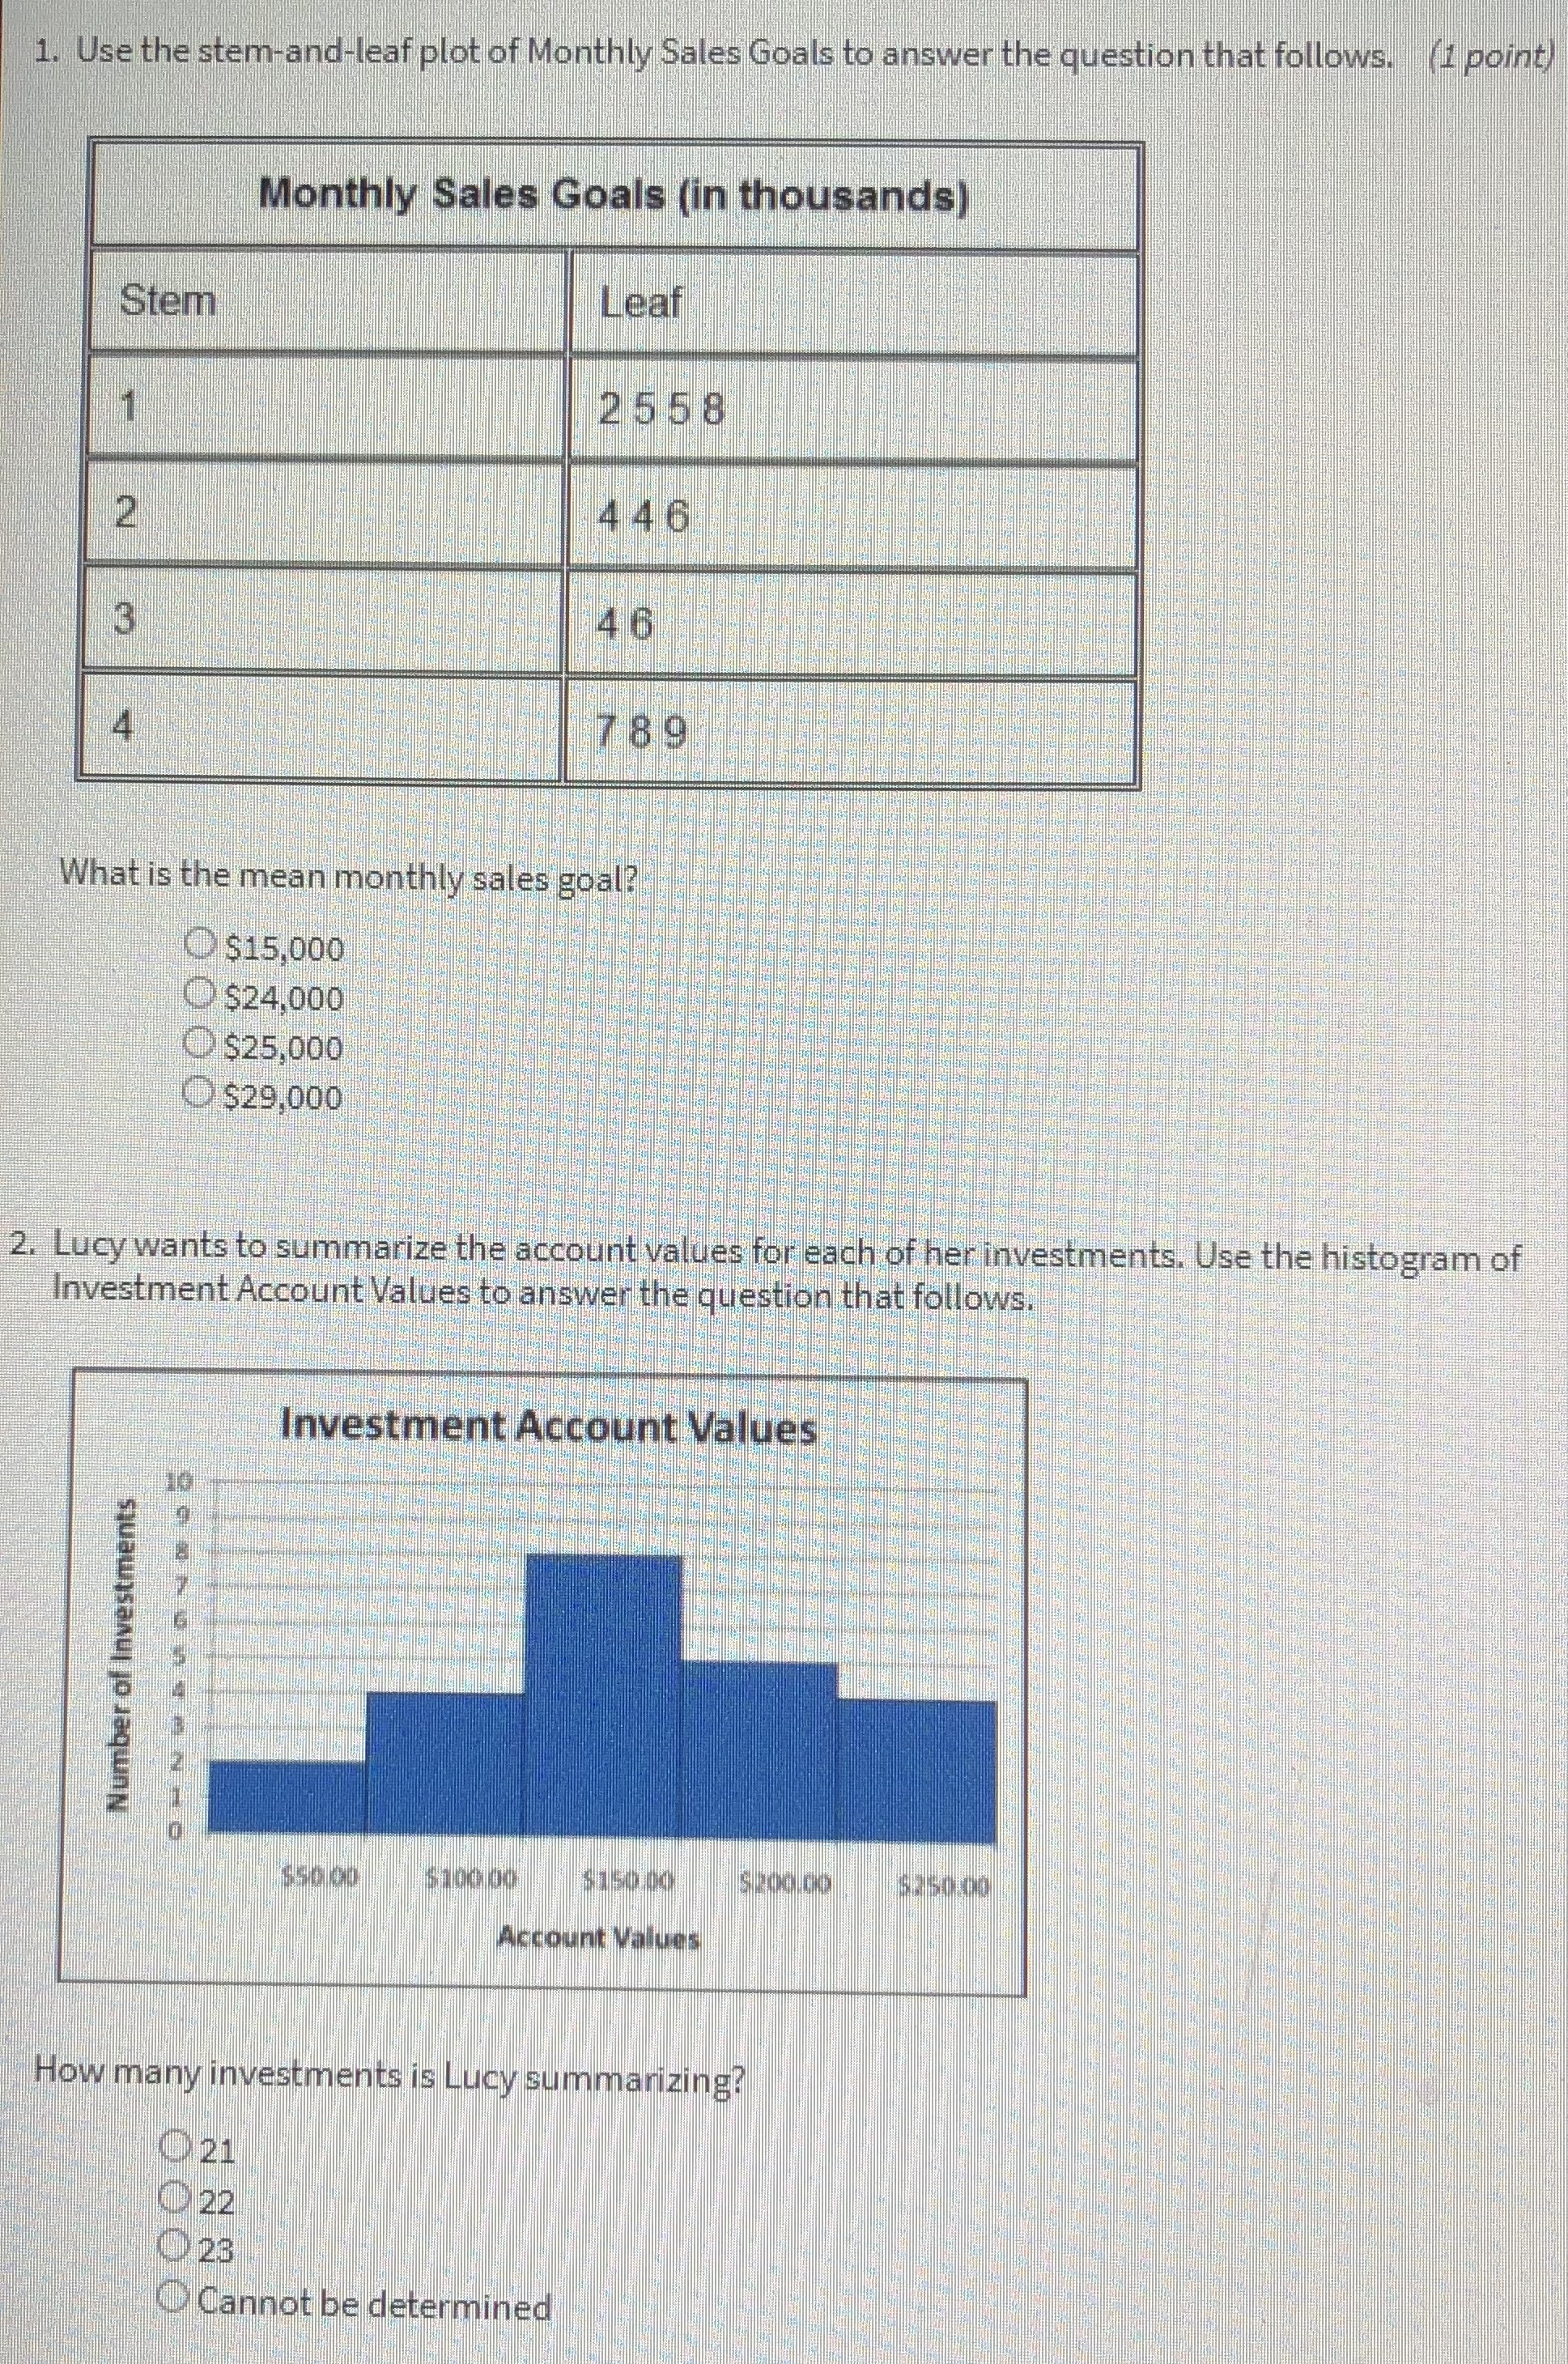
need help with my homewormk 1. Use the stem-and-leaf plot of Monthly Sales Goals to answer the question that follows. (1 point) Monthly Sales Goals

need help with my homewormk

image text in transcribedimage text in transcribedimage text in transcribed
1. Use the stem-and-leaf plot of Monthly Sales Goals to answer the question that follows. (1 point) Monthly Sales Goals (in thousands) Stem Leaf 2558 4 46 46 789 What is the mean monthly sales goal? $15,000 $24,000 $25,000 $29,000 2. Lucy wants to summarize the account values for each of her investments. Use the histogram of Investment Account Values to answer the question that follows. Investment Account Values Number of Investments $50 00 5100 00 $ 209.30 5250-90 Account Values How many investments is Lucy summarizing? 21 22 23 Cannot be determinedChange in Price of a Stock 12:00 pm $450 12:05 pm $420 12:10 pm $405 12:15 pm $395 12:20 pm $386 12:25 pm $378 12:30 pm $369 A student is trying to compile a visual display of the change in price of a stock over a period of time. Which type of display will give them the best picture of their student's data? Box-and-Whisker Plot Bar Graph O Line Graph Circle Graph Calories Ingested 3000 2500 2000 Calories 1500 1090 500 Monday Tuesday| Wednesday Thursday Day Patrick created a presentation for his trainer showing the amount of calories ingested during his work week. He wants to know if there is a correlation between the calories he ingested each day and his weight. What is an alternative data display that would better convey the information? Box-and-Whisker Plot Stem-and-Leaf Plot Scatter Plot Circle Graph5. Natalie wants to create a visual representation of how much of her monthly income is spent on her bills (6 points) each month. Below is the line graph she designed. Monthly Expenses $600 $500 $400 Cost of Expenses $300 $300 $100 Rent Cell phone Cable Expense Categories Explain, using complete sentences, whether or not this is the most appropriate format for representing this data and why. If it is not the best format, explain which format should have been used instead

Step by Step Solution

There are 3 Steps involved in it

Step: 1

blur-text-image

Get Instant Access to Expert-Tailored Solutions

See step-by-step solutions with expert insights and AI powered tools for academic success

Step: 2

blur-text-image

Step: 3

blur-text-image

Ace Your Homework with AI

Get the answers you need in no time with our AI-driven, step-by-step assistance

Get Started

Recommended Textbook for

Making Hard Decisions with decision tools

Authors: Robert Clemen, Terence Reilly

3rd edition

538797576, 978-0538797573

More Books

Students also viewed these Mathematics questions

Question

ECPI University - Northern VA Ca... McGraw-Hill ALEKS

Answered: 1 week ago