

Question
Need help with Part 1 and part 2 questions based on RStudio program, using the (dplyr package), following are data from two files Measurements.txt and
Need help with Part 1 and part 2 questions based on RStudio program, using the (dplyr package), following are data from two files Measurements.txt and PermanentInfo.txt. Insert these data in an axcel and txt files, so you can upload these two files to RStudio by typing:
(Measurements
These data from the (Measurements.csv) excel file:
| BearID | Year | DayOfYear | BodyLength.cm | AxillaryGirth.cm | HeadLength.mm | ZygomaticBreadth.mm |
| X70611 | 2006 | 49 | 189 | 119 | 342 | 210 |
| X70867 | 2006 | 49 | 192 | -999 | 359 | 197 |
| X69309 | 2006 | 52 | 194 | -999 | 353 | 200 |
| X69041 | 2006 | 58 | 201 | 121 | 344 | 209 |
| X67484 | 2006 | 59 | 199 | 123 | 361 | 215 |
| X69753 | 2006 | 61 | 197 | 108 | 342 | 201 |
| X70457 | 2006 | 61 | 185 | 112 | 345 | 194 |
| X68320 | 2006 | 63 | 201 | 120 | 353 | 206 |
| X68766 | 2006 | 64 | 205 | 116 | 372 | 206 |
| X77249 | 2006 | 64 | 191 | 107 | 345 | 197 |
The following data from (PermanentInfo.txt) file:
BearID YearOfBirth Sex X61406 1981 F X61445 1991 M X61449 1992 M X61467 1992 M X61469 1992 M X61501 1994 M X61507 1996 M X61511 1996 F X61513 1997 M X61521 1996 M
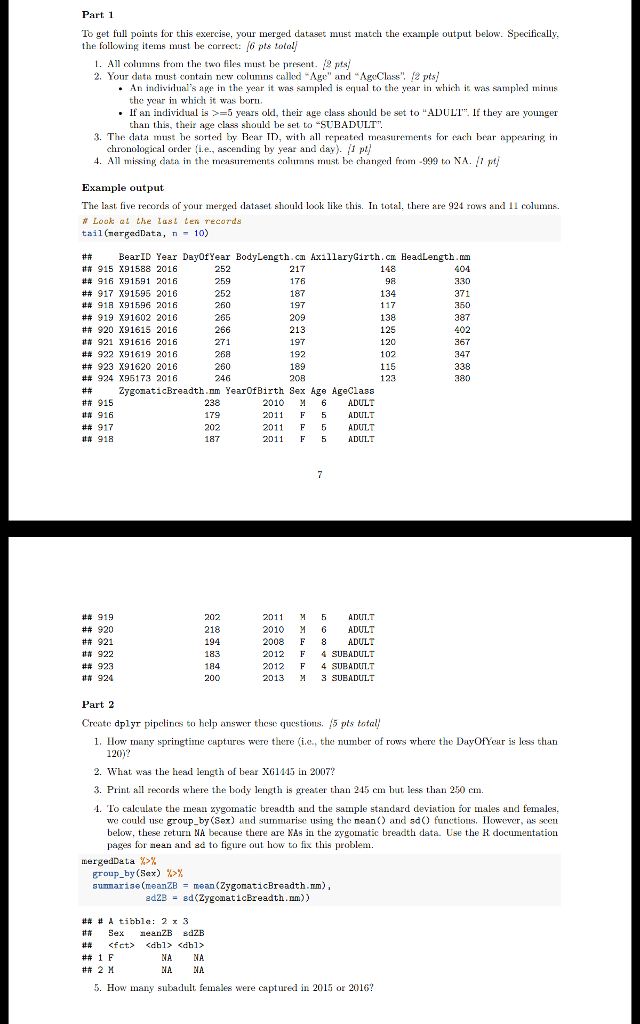
Part 1 To get full points for this exercise, your merged dataset must match the example output below. Specifically, the following sst he correct: pts total 1. All columns from the two files must be present. pts 2. Your dta must contain ow lled"Age" and AgeClass"pts An individual's age in the year it was sampled is eal to the year in which it was sampled mins . lf an individual is >=5 years old, their age class should be set to "ADUL". If they are younger 3. The data mst he srted by Rear TD, it a epeated measurements for each bear appearing in the year in which it was born than this, their age class should be seSUBADULT". chronological order (i.e., ascending by year and day). /1 pt/ 4. All missing data in the easnts ons must be changed from -999 to NA. I Example output The last five records of your merged dataset should look like this. In total, there are 924 rows and 11 columns tail (mergadData, n-10) ## BearID Year Day0fYear BodyLength.cm AxillaryGirth.a Headlength.mn 915 X91588 2016 252 259 252 217 176 187 197 148 ## 916 X91591 2016 ## 917 X91595 2016 ## 918 X91596 2016 ## 919 X91602 2016 134 371 350 387 138 125 120 102 115 920 X91615 2016 # 921 X91616 2016 ## 922 X91619 2016 ## 923 X91620 2016 ## 924 X95173 2016 ## ZygomaticBreadth.nm YearOfBirth Sex Age AgeClass # 915 197 192 189 205 271 347 2010 M6ADULT 2011 F 5 ADULT 2011 F 5 ADULT 2011 F 5 ADULT 916 179 ## 917 # 918 187 ## 919 ## 920 921 922 ## 923 924 202 218 194 183 184 2011 M5 ADUL.T 2010 M 6ADULT 2008 F 8ADULT 2012 F SUEADULT 2012 F 4 SUBADUTL.T 2013 M 3 SUEADULT Part 2 Create dplyr pipelines to help answer these question5 pts tatal 1. How any springtie captures were thee the number of rows where the DayOfYear is less than 120)? 2. What was the head length of bear XG1115 in 2007? 3. Print all records whre the body length is greater than 245 e but less than 250 enm. 1. To caleulate the mea xygomatic breadth and the sample standard deviation for males and females, we could usc group by(Sex) nd suarise using the nean and sdO functions, However, as sceu below, these return NA because there are XAs in the zygomatic breadth data. Use the R documentation pages for mean and sd to figure out how to fix this problem mergedData X>% group-by (Sex) %> sumarise(meanZB = mean (ZygonaticBreadth.mm)' adZB -8d(ZygaticBreadth.mm) ) ## # A tibble: 2x3 ## 1 F ## 2M MA NA 5. Hov many subadult females were captured in 2015 or 2016 Part 1 To get full points for this exercise, your merged dataset must match the example output below. Specifically, the following sst he correct: pts total 1. All columns from the two files must be present. pts 2. Your dta must contain ow lled"Age" and AgeClass"pts An individual's age in the year it was sampled is eal to the year in which it was sampled mins . lf an individual is >=5 years old, their age class should be set to "ADUL". If they are younger 3. The data mst he srted by Rear TD, it a epeated measurements for each bear appearing in the year in which it was born than this, their age class should be seSUBADULT". chronological order (i.e., ascending by year and day). /1 pt/ 4. All missing data in the easnts ons must be changed from -999 to NA. I Example output The last five records of your merged dataset should look like this. In total, there are 924 rows and 11 columns tail (mergadData, n-10) ## BearID Year Day0fYear BodyLength.cm AxillaryGirth.a Headlength.mn 915 X91588 2016 252 259 252 217 176 187 197 148 ## 916 X91591 2016 ## 917 X91595 2016 ## 918 X91596 2016 ## 919 X91602 2016 134 371 350 387 138 125 120 102 115 920 X91615 2016 # 921 X91616 2016 ## 922 X91619 2016 ## 923 X91620 2016 ## 924 X95173 2016 ## ZygomaticBreadth.nm YearOfBirth Sex Age AgeClass # 915 197 192 189 205 271 347 2010 M6ADULT 2011 F 5 ADULT 2011 F 5 ADULT 2011 F 5 ADULT 916 179 ## 917 # 918 187 ## 919 ## 920 921 922 ## 923 924 202 218 194 183 184 2011 M5 ADUL.T 2010 M 6ADULT 2008 F 8ADULT 2012 F SUEADULT 2012 F 4 SUBADUTL.T 2013 M 3 SUEADULT Part 2 Create dplyr pipelines to help answer these question5 pts tatal 1. How any springtie captures were thee the number of rows where the DayOfYear is less than 120)? 2. What was the head length of bear XG1115 in 2007? 3. Print all records whre the body length is greater than 245 e but less than 250 enm. 1. To caleulate the mea xygomatic breadth and the sample standard deviation for males and females, we could usc group by(Sex) nd suarise using the nean and sdO functions, However, as sceu below, these return NA because there are XAs in the zygomatic breadth data. Use the R documentation pages for mean and sd to figure out how to fix this problem mergedData X>% group-by (Sex) %> sumarise(meanZB = mean (ZygonaticBreadth.mm)' adZB -8d(ZygaticBreadth.mm) ) ## # A tibble: 2x3 ## 1 F ## 2M MA NA 5. Hov many subadult females were captured in 2015 or 2016Step by Step Solution
There are 3 Steps involved in it
Step: 1

Get Instant Access to Expert-Tailored Solutions
See step-by-step solutions with expert insights and AI powered tools for academic success
Step: 2

Step: 3
Ace Your Homework with AI
Get the answers you need in no time with our AI-driven, step-by-step assistance
Get Started
Microsoft SQL Server 2012 Unleashed
Authors: Ray Rankins, Paul Bertucci
1st Edition
0133408507, 9780133408508