need help with part 3 of this assignment
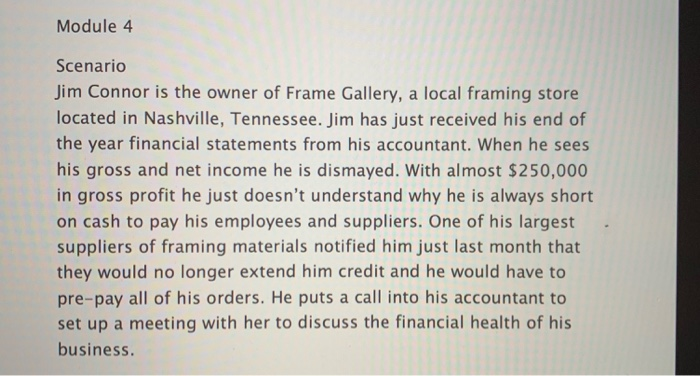
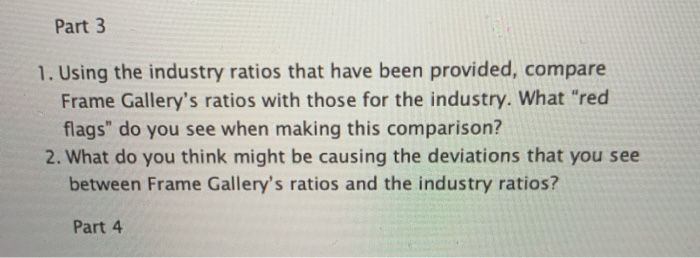
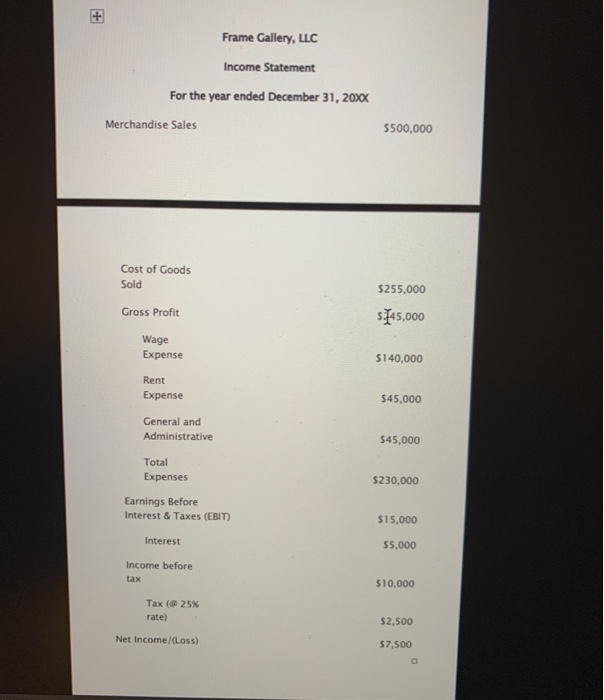
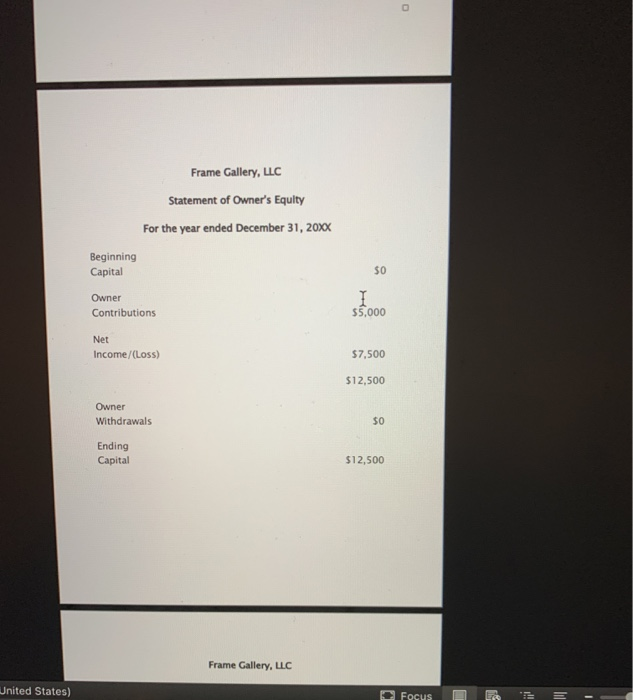
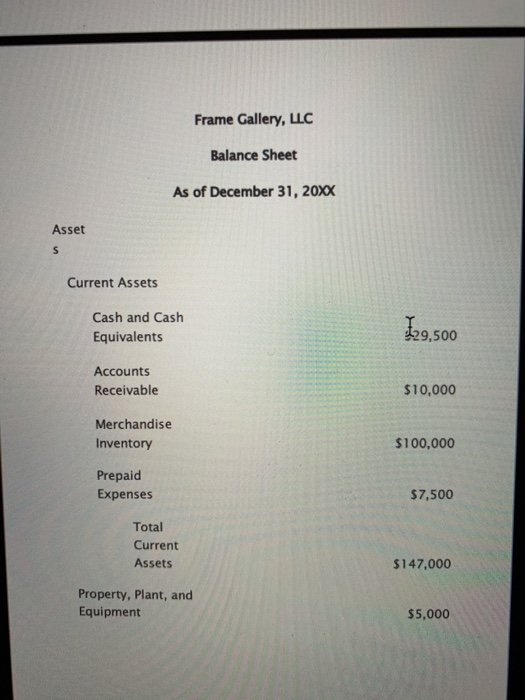
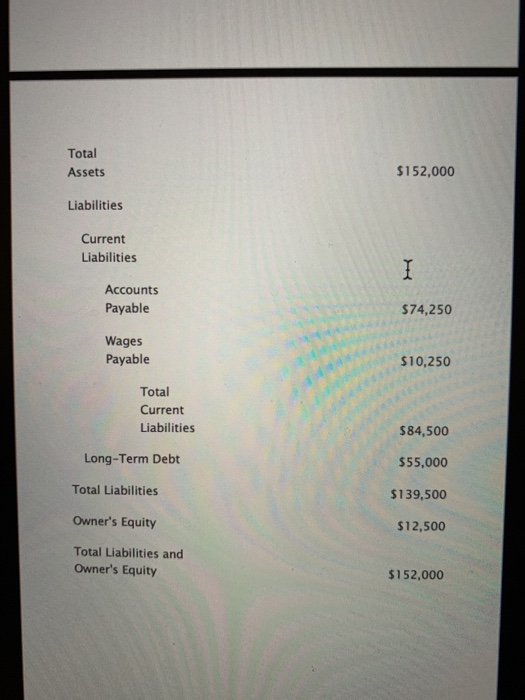
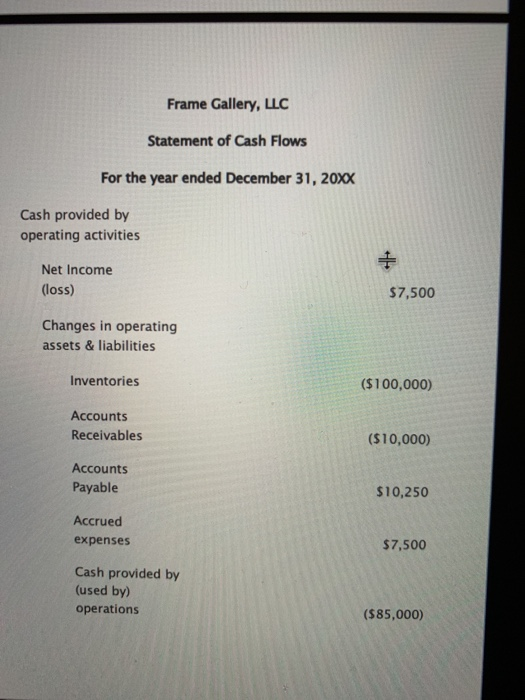
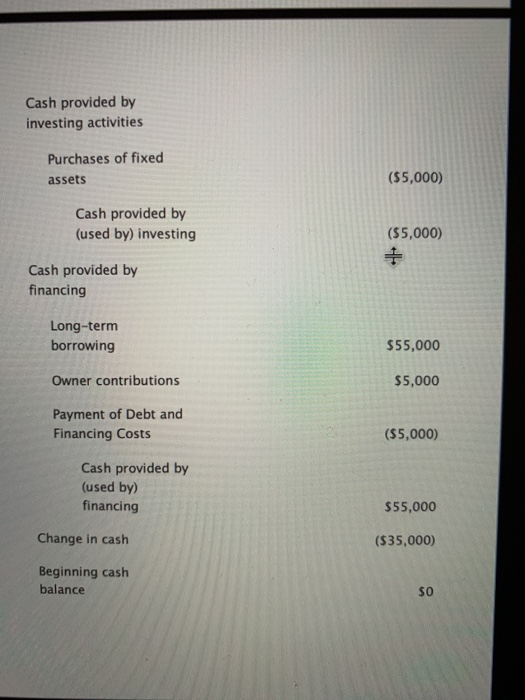
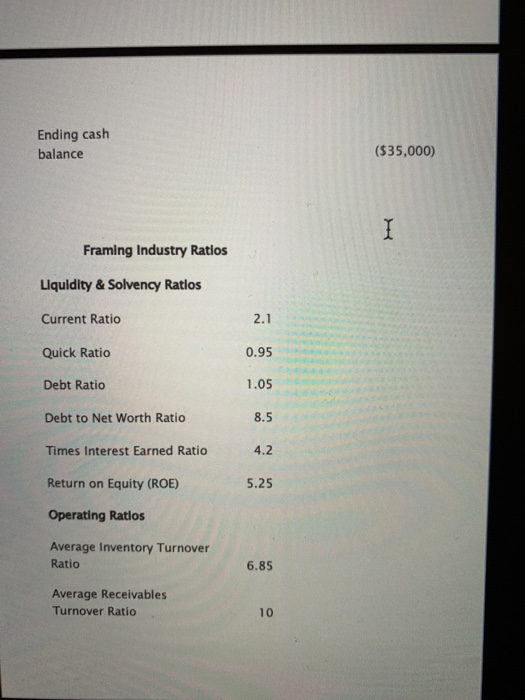
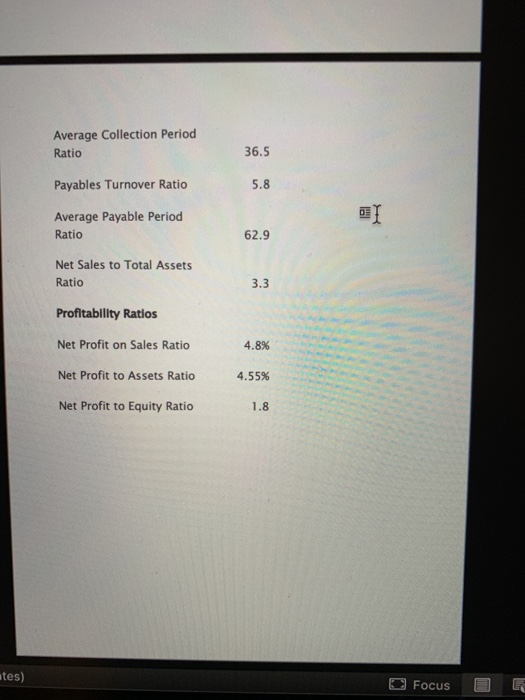
Module 4 Scenario Jim Connor is the owner of Frame Gallery, a local framing store located in Nashville, Tennessee. Jim has just received his end of the year financial statements from his accountant. When he sees his gross and net income he is dismayed. With almost $250,000 in gross profit he just doesn't understand why he is always short on cash to pay his employees and suppliers. One of his largest suppliers of framing materials notified him just last month that they would no longer extend him credit and he would have to pre-pay all of his orders. He puts a call into his accountant to set up a meeting with her to discuss the financial health of his business. Part 3 1. Using the industry ratios that have been provided, compare Frame Gallery's ratios with those for the industry. What "red flags" do you see when making this comparison? 2. What do you think might be causing the deviations that you see between Frame Gallery's ratios and the industry ratios? Part 4 Frame Gallery, LLC Income Statement For the year ended December 31, 20XX Merchandise Sales $500,000 Cost of Goods Sold $255,000 5:145,000 Gross Profit Wage Expense $140,000 Rent Expense $45,000 General and Administrative $45,000 Total Expenses $230,000 Earnings Before Interest & Taxes (EBIT) $15.000 Interest $5,000 Income before tax $10,000 Tax (@25% rate) Net Income/(Loss) $2,500 $7,500 Frame Gallery, LLC Statement of Owner's Equity For the year ended December 31, 20XX Beginning Capital Owner Contributions $5,000 Net Income/(Loss) $7,500 $12,500 Owner Withdrawals Ending Capital $12,500 Frame Gallery, LLC United States) Focus - Frame Gallery, LLC Balance Sheet As of December 31, 20XX Asset Current Assets Cash and Cash Equivalents 29,500 Accounts Receivable $10,000 Merchandise Inventory $100,000 Prepaid Expenses $7,500 Total Current Assets $147,000 Property, Plant, and Equipment $5,000 Total Assets $152,000 Liabilities Current Liabilities Accounts Payable $74,250 Wages Payable $10,250 Total Current Liabilities $84,500 Long-Term Debt $55,000 Total Liabilities $139,500 Owner's Equity $12,500 Total Liabilities and Owner's Equity $152,000 Frame Gallery, LLC Statement of Cash Flows For the year ended December 31, 20xx Cash provided by operating activities Net Income (loss) $7,500 Changes in operating assets & liabilities Inventories ($100,000) Accounts Receivables ($10,000) Accounts Payable $10,250 Accrued expenses $7,500 Cash provided by (used by) operations (585,000) Cash provided by investing activities Purchases of fixed assets ($5,000) Cash provided by (used by) investing ($5,000) Cash provided by financing Long-term borrowing $55,000 Owner contributions $5,000 Payment of Debt and Financing Costs ($5,000) Cash provided by (used by) financing $55,000 Change in cash ($35,000) Beginning cash balance $o Ending cash balance ($35,000) Framing Industry Ratios Liquidity & Solvency Ratios Current Ratio Quick Ratio Debt Ratio Debt to Net Worth Ratio Times Interest Earned Ratio Return on Equity (ROE) Operating Ratlos Average Inventory Turnover Ratio Average Receivables Turnover Ratio Average Collection Period Ratio 36.5 Payables Turnover Ratio Average Payable Period Ratio 62.9 Net Sales to Total Assets Ratio 3.3 Profitability Ratios Net Profit on Sales Ratio 4.8% Net Profit to Assets Ratio 4.55% Net Profit to Equity Ratio 1.8 tes) O Focus B E Module 4 Scenario Jim Connor is the owner of Frame Gallery, a local framing store located in Nashville, Tennessee. Jim has just received his end of the year financial statements from his accountant. When he sees his gross and net income he is dismayed. With almost $250,000 in gross profit he just doesn't understand why he is always short on cash to pay his employees and suppliers. One of his largest suppliers of framing materials notified him just last month that they would no longer extend him credit and he would have to pre-pay all of his orders. He puts a call into his accountant to set up a meeting with her to discuss the financial health of his business. Part 3 1. Using the industry ratios that have been provided, compare Frame Gallery's ratios with those for the industry. What "red flags" do you see when making this comparison? 2. What do you think might be causing the deviations that you see between Frame Gallery's ratios and the industry ratios? Part 4 Frame Gallery, LLC Income Statement For the year ended December 31, 20XX Merchandise Sales $500,000 Cost of Goods Sold $255,000 5:145,000 Gross Profit Wage Expense $140,000 Rent Expense $45,000 General and Administrative $45,000 Total Expenses $230,000 Earnings Before Interest & Taxes (EBIT) $15.000 Interest $5,000 Income before tax $10,000 Tax (@25% rate) Net Income/(Loss) $2,500 $7,500 Frame Gallery, LLC Statement of Owner's Equity For the year ended December 31, 20XX Beginning Capital Owner Contributions $5,000 Net Income/(Loss) $7,500 $12,500 Owner Withdrawals Ending Capital $12,500 Frame Gallery, LLC United States) Focus - Frame Gallery, LLC Balance Sheet As of December 31, 20XX Asset Current Assets Cash and Cash Equivalents 29,500 Accounts Receivable $10,000 Merchandise Inventory $100,000 Prepaid Expenses $7,500 Total Current Assets $147,000 Property, Plant, and Equipment $5,000 Total Assets $152,000 Liabilities Current Liabilities Accounts Payable $74,250 Wages Payable $10,250 Total Current Liabilities $84,500 Long-Term Debt $55,000 Total Liabilities $139,500 Owner's Equity $12,500 Total Liabilities and Owner's Equity $152,000 Frame Gallery, LLC Statement of Cash Flows For the year ended December 31, 20xx Cash provided by operating activities Net Income (loss) $7,500 Changes in operating assets & liabilities Inventories ($100,000) Accounts Receivables ($10,000) Accounts Payable $10,250 Accrued expenses $7,500 Cash provided by (used by) operations (585,000) Cash provided by investing activities Purchases of fixed assets ($5,000) Cash provided by (used by) investing ($5,000) Cash provided by financing Long-term borrowing $55,000 Owner contributions $5,000 Payment of Debt and Financing Costs ($5,000) Cash provided by (used by) financing $55,000 Change in cash ($35,000) Beginning cash balance $o Ending cash balance ($35,000) Framing Industry Ratios Liquidity & Solvency Ratios Current Ratio Quick Ratio Debt Ratio Debt to Net Worth Ratio Times Interest Earned Ratio Return on Equity (ROE) Operating Ratlos Average Inventory Turnover Ratio Average Receivables Turnover Ratio Average Collection Period Ratio 36.5 Payables Turnover Ratio Average Payable Period Ratio 62.9 Net Sales to Total Assets Ratio 3.3 Profitability Ratios Net Profit on Sales Ratio 4.8% Net Profit to Assets Ratio 4.55% Net Profit to Equity Ratio 1.8 tes) O Focus B E