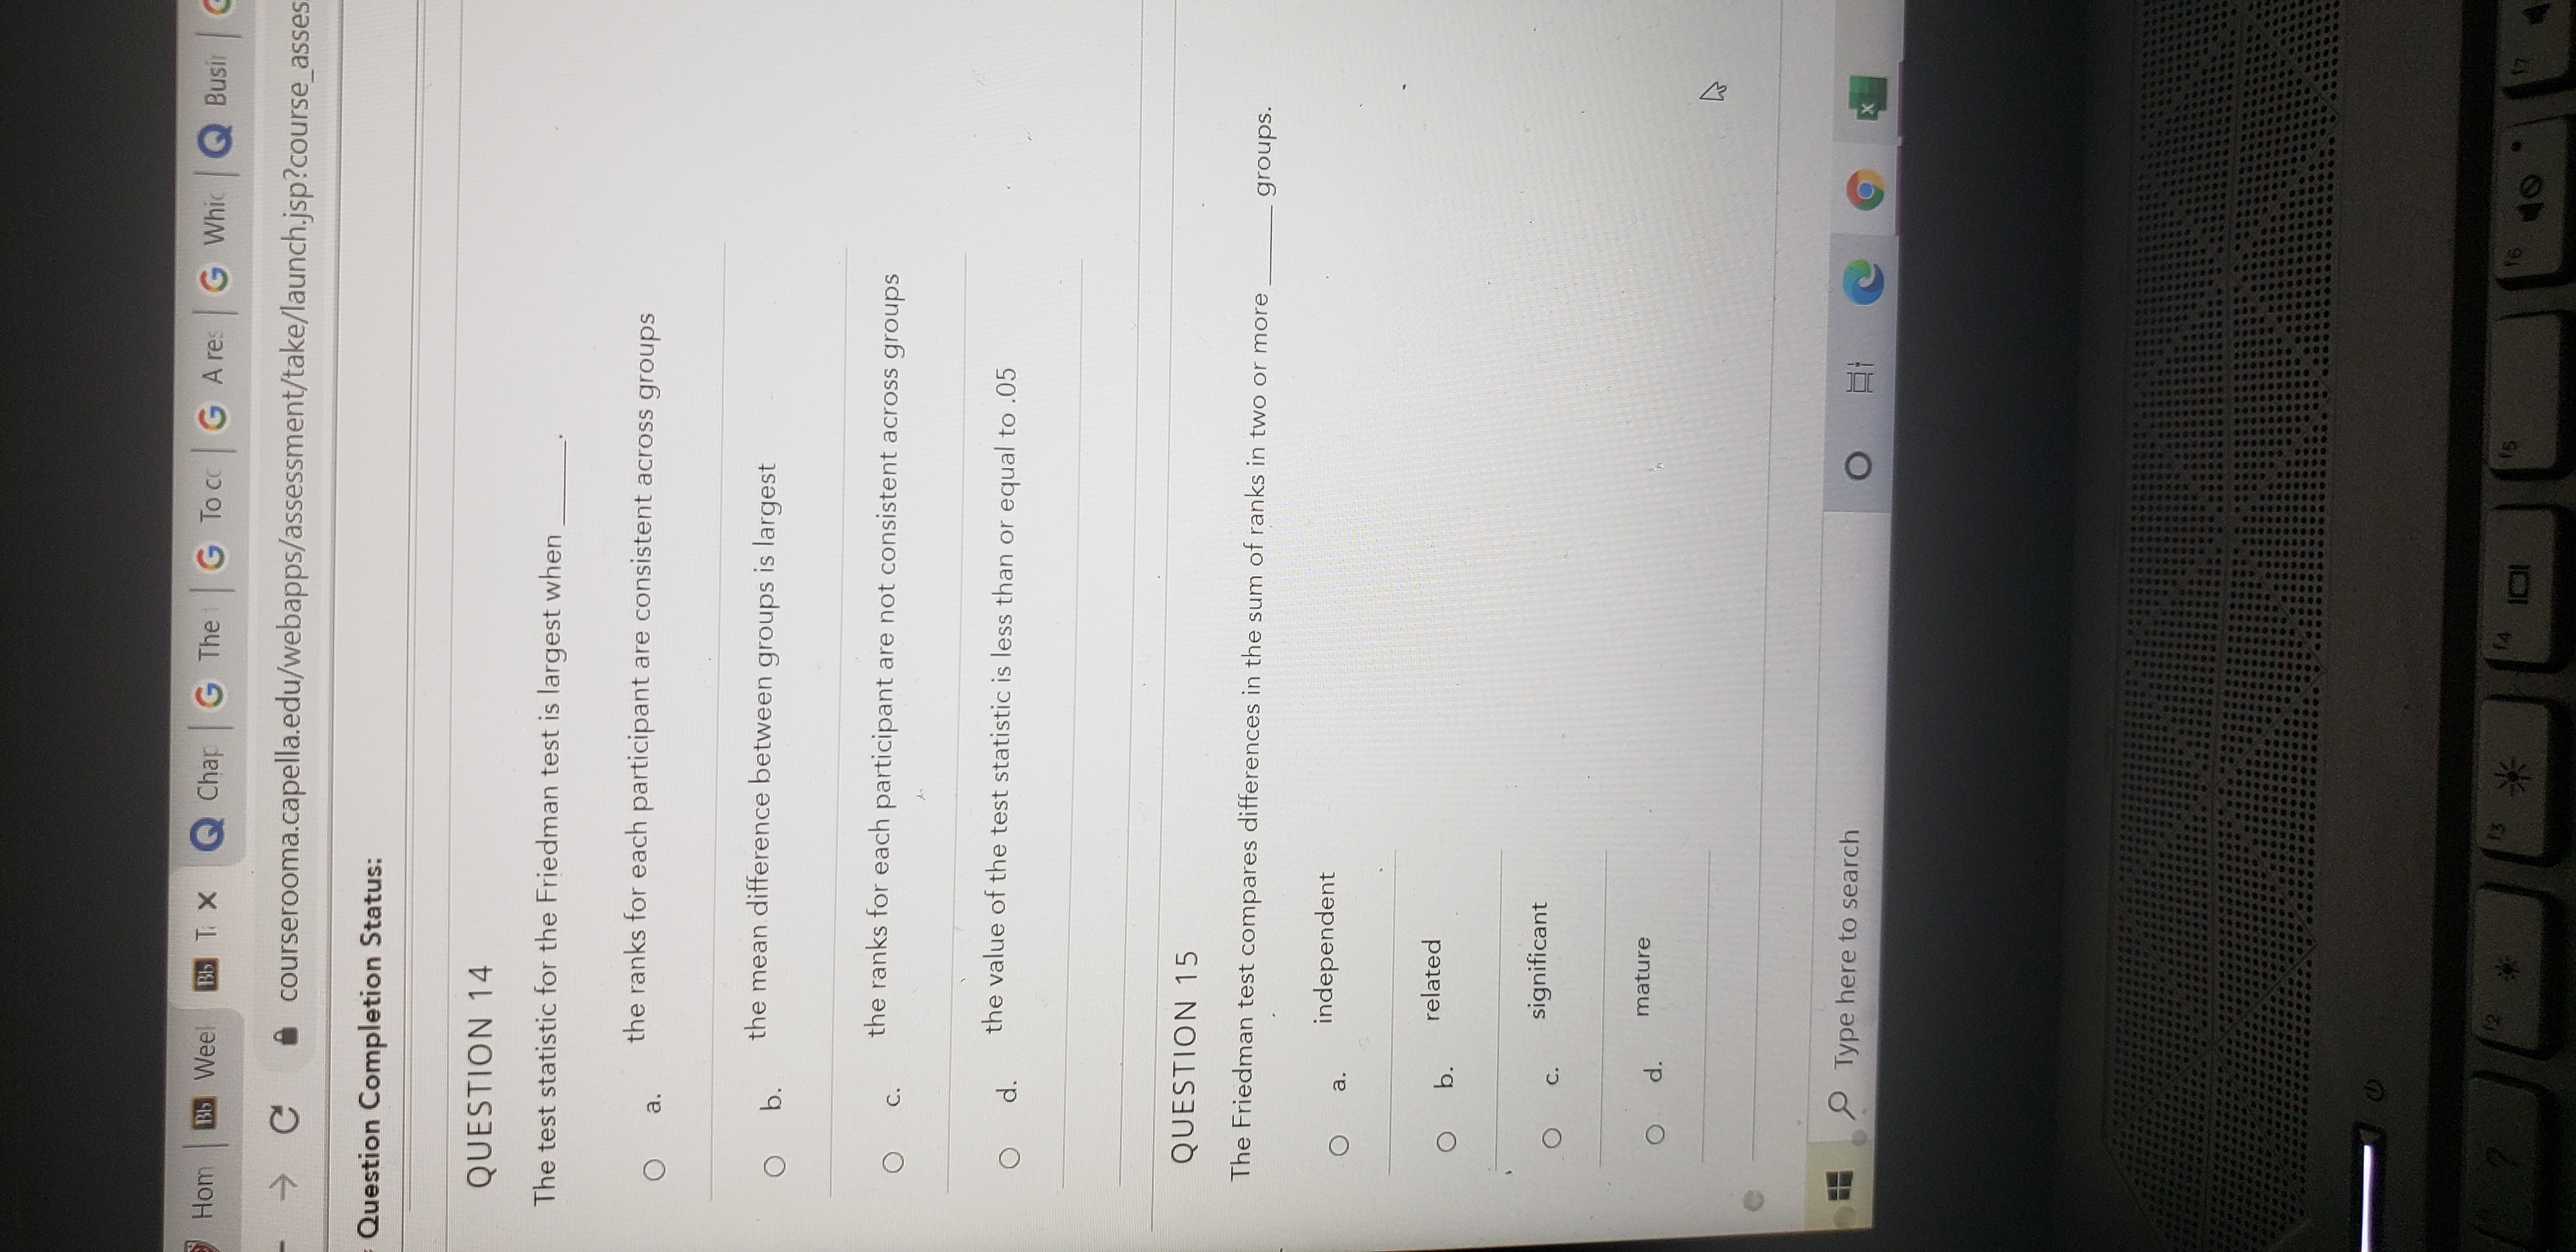
Need help with question 4,9, 10,11,12, 13,14 and 15
lom B Wee Bb T. X @ Chap G The G Toc. G Are: G Whic | Q Busi | G Whic | G Whic | Q Data | Q Bios @ Bios | Quiz C courserooma.capella.edu/webapps/assessment/take/launch.jsp?course_assessment_id=_95616_1&course_id=_266636_1&content_id=_9 estion Completion Status: a. the number of predictor variables O b. the number of predictor variables minus one O C. n - 1 O d. n - 2 QUESTION 4 he predictions made using multiple regression are often more _ than the predictions made using linear regression with one predictor variable. O a. informative O b. convoluted O C. confounded O d. realistic QUESTION 5 For a multiple regression analysis with 2 and 12 degrees of freedom, MS regression is 135 and MS residual is 15. What is the decision for this test? reject the null hypothesis; the predictive variability of two predictor factors are significant 9 Type here to search O 4 101 2 # 3 4 5 6 8 W E R T Y U O S D F G H J K L X C V B N MHom Bb Weel Bb T. X Q Char G The G To cc G Ares | G Whic | Q Busi | G Whic | G Whic | Data | Bios: C A courserooma.capella.edu/webapps/assessment/take/launch.jsp?course_assessment_id=_95616_1&course_id=_266636 uestion Completion Status: O a. interval and ratio data O b. ordinal and interval data C . nominal and ordinal data O d. ordinal and ratio data QUESTION 9 Which of the following dispersions of scores for three groups (A, B, and C) best illustrate the null hypothesis for a Kruskal-Wallis H test? O a. The number of scores above and below the median are equal. O b. The mean differences between two groups are equal. O C . The sum of ranks in each group does not differ between groups. O d. The ranks in two groups are equal to O. QUESTION 10 The test statistic (x) for the sign test is equal to a. variability attributed to the groups divided by variability attributed to error Type here to search O X ? - 144 @ 2 # 3 % 4 5 Q W E R T Y U A S D F G H J K Z X C V B N M altHom Bb Weel Bb T. X @ Char G The | G Toc | G Are | G Whic | @ Busir | G Whic | G Whit | Data | @ Bios @ Bios | Quiz | @ Char . Quiz C 0 courserooma.capella.edu/webapps/assessment/take/launch.jsp?course_assessment_id=_95616_1&course_id=_266636_1&content_id=_9008433_1&step=null Question Completion Status: QUESTION 10 The test statistic (x) for the sign test is equal to O a. variability attributed to the groups divided by variability attributed to error O b. the number of pluses or minuses, whichever occurs most often O C. the number of scores that are less than or equal to the median value O d. the number of positive scores divided by the number of negative scores QUESTION 11 A researcher computes the Wilcoxon signed-ranks T test. She finds that the sum of positive ranks is 56 and the sum of negative ranks is 22. What is the value of the test statistic, T? O a. 22 b. 34 O C. 56 O d. 78 QUESTION 12 Type here to search O " 40 4+ & 2 3 4 7 8 9 O E R P A S D F H J K Z X C V B N M alt alt IONE FORHom Bb Weel Bb T. X Q Chap G The G To cc G Ares G Whic | @ Busi G Whic | G Whic Q Data Q Biost Q Biost C courserooma.capella.edu/webapps/assessment/take/launch.jsp?course_assessment_id=_95616_1&course_id=_266636_1&conter Question Completion Status: QUESTION 12 To compute the test statistic for the Mann-Whitney U test, we sum the ranks in two groups. The test statistic is O a . the larger total O b. the smaller total O C. the average of the two totals O d. the product of the two totals QUESTION 13 What is the null hypothesis for a Kruskal-Wallis H test? a. The number of scores above and below the median are equal. O b . The sum of ranks in each group does not differ between groups. O C . The median differences between two groups are equal. O d. The ranks in two groups are equal to 0. Type here to search O 14 101 4- 144 @ 2 # 3 4 5 7 9 Q W E R T Y U A S D F G H J K Z X C V B N M altHom Bb Week Bb T. X @ Chap G The G To cc G Ares G Whic @ Busir courserooma.capella.edu/webapps/assessment/take/launch.jsp? course_asses Question Completion Status: QUESTION 14 The test statistic for the Friedman test is largest when O a . the ranks for each participant are consistent across groups O b. the mean difference between groups is largest O C. the ranks for each participant are not consistent across groups O d. the value of the test statistic is less than or equal to .05 QUESTION 15 The Friedman test compares differences in the sum of ranks in two or more groups. O a . independent O b . related O C . significant O d. mature Type here to search O Et e X 12 13 14 16


