

Question: Need help with question 5, 6, and 7 already have questions 3 and 4 solved 3. S= 2.622 4. 5.75% 3. Calculate an estimate of
Need help with question 5, 6, and 7 already have questions 3 and 4 solved
3. S= 2.622
4. 5.75%
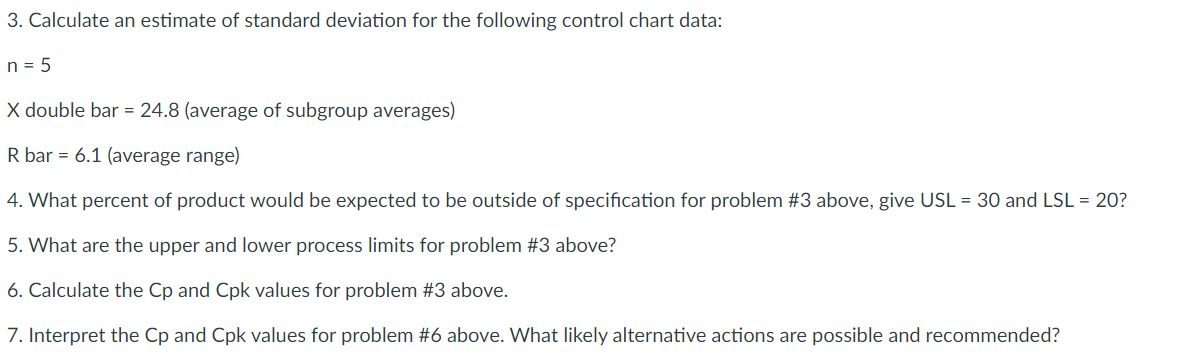
3. Calculate an estimate of standard deviation for the following control chart data: n = 5 X double bar = 24.8 (average of subgroup averages) R bar = 6.1 (average range) 4. What percent of product would be expected to be outside of specification for problem #3 above, give USL = 30 and LSL = 20? 5. What are the upper and lower process limits for problem #3 above? 6. Calculate the Cp and Cpk values for problem #3 above. 7. Interpret the Cp and Cpk values for problem #6 above. What likely alternative actions are possible and recommended
Step by Step Solution
There are 3 Steps involved in it
1 Expert Approved Answer
Step: 1 Unlock

Question Has Been Solved by an Expert!
Get step-by-step solutions from verified subject matter experts
Step: 2 Unlock
Step: 3 Unlock