

Question: Need help with screenshots 1, 2, 3, 5, 6, 7, 8, and finally, 10. All information needed are in screenshots below. However, if you need
Need help with screenshots 1, 2, 3, 5, 6, 7, 8, and finally, 10. All information needed are in screenshots below. However, if you need any more information, do not hesitate to leave a comment below! Please number them as I have as well. THANK YOU!
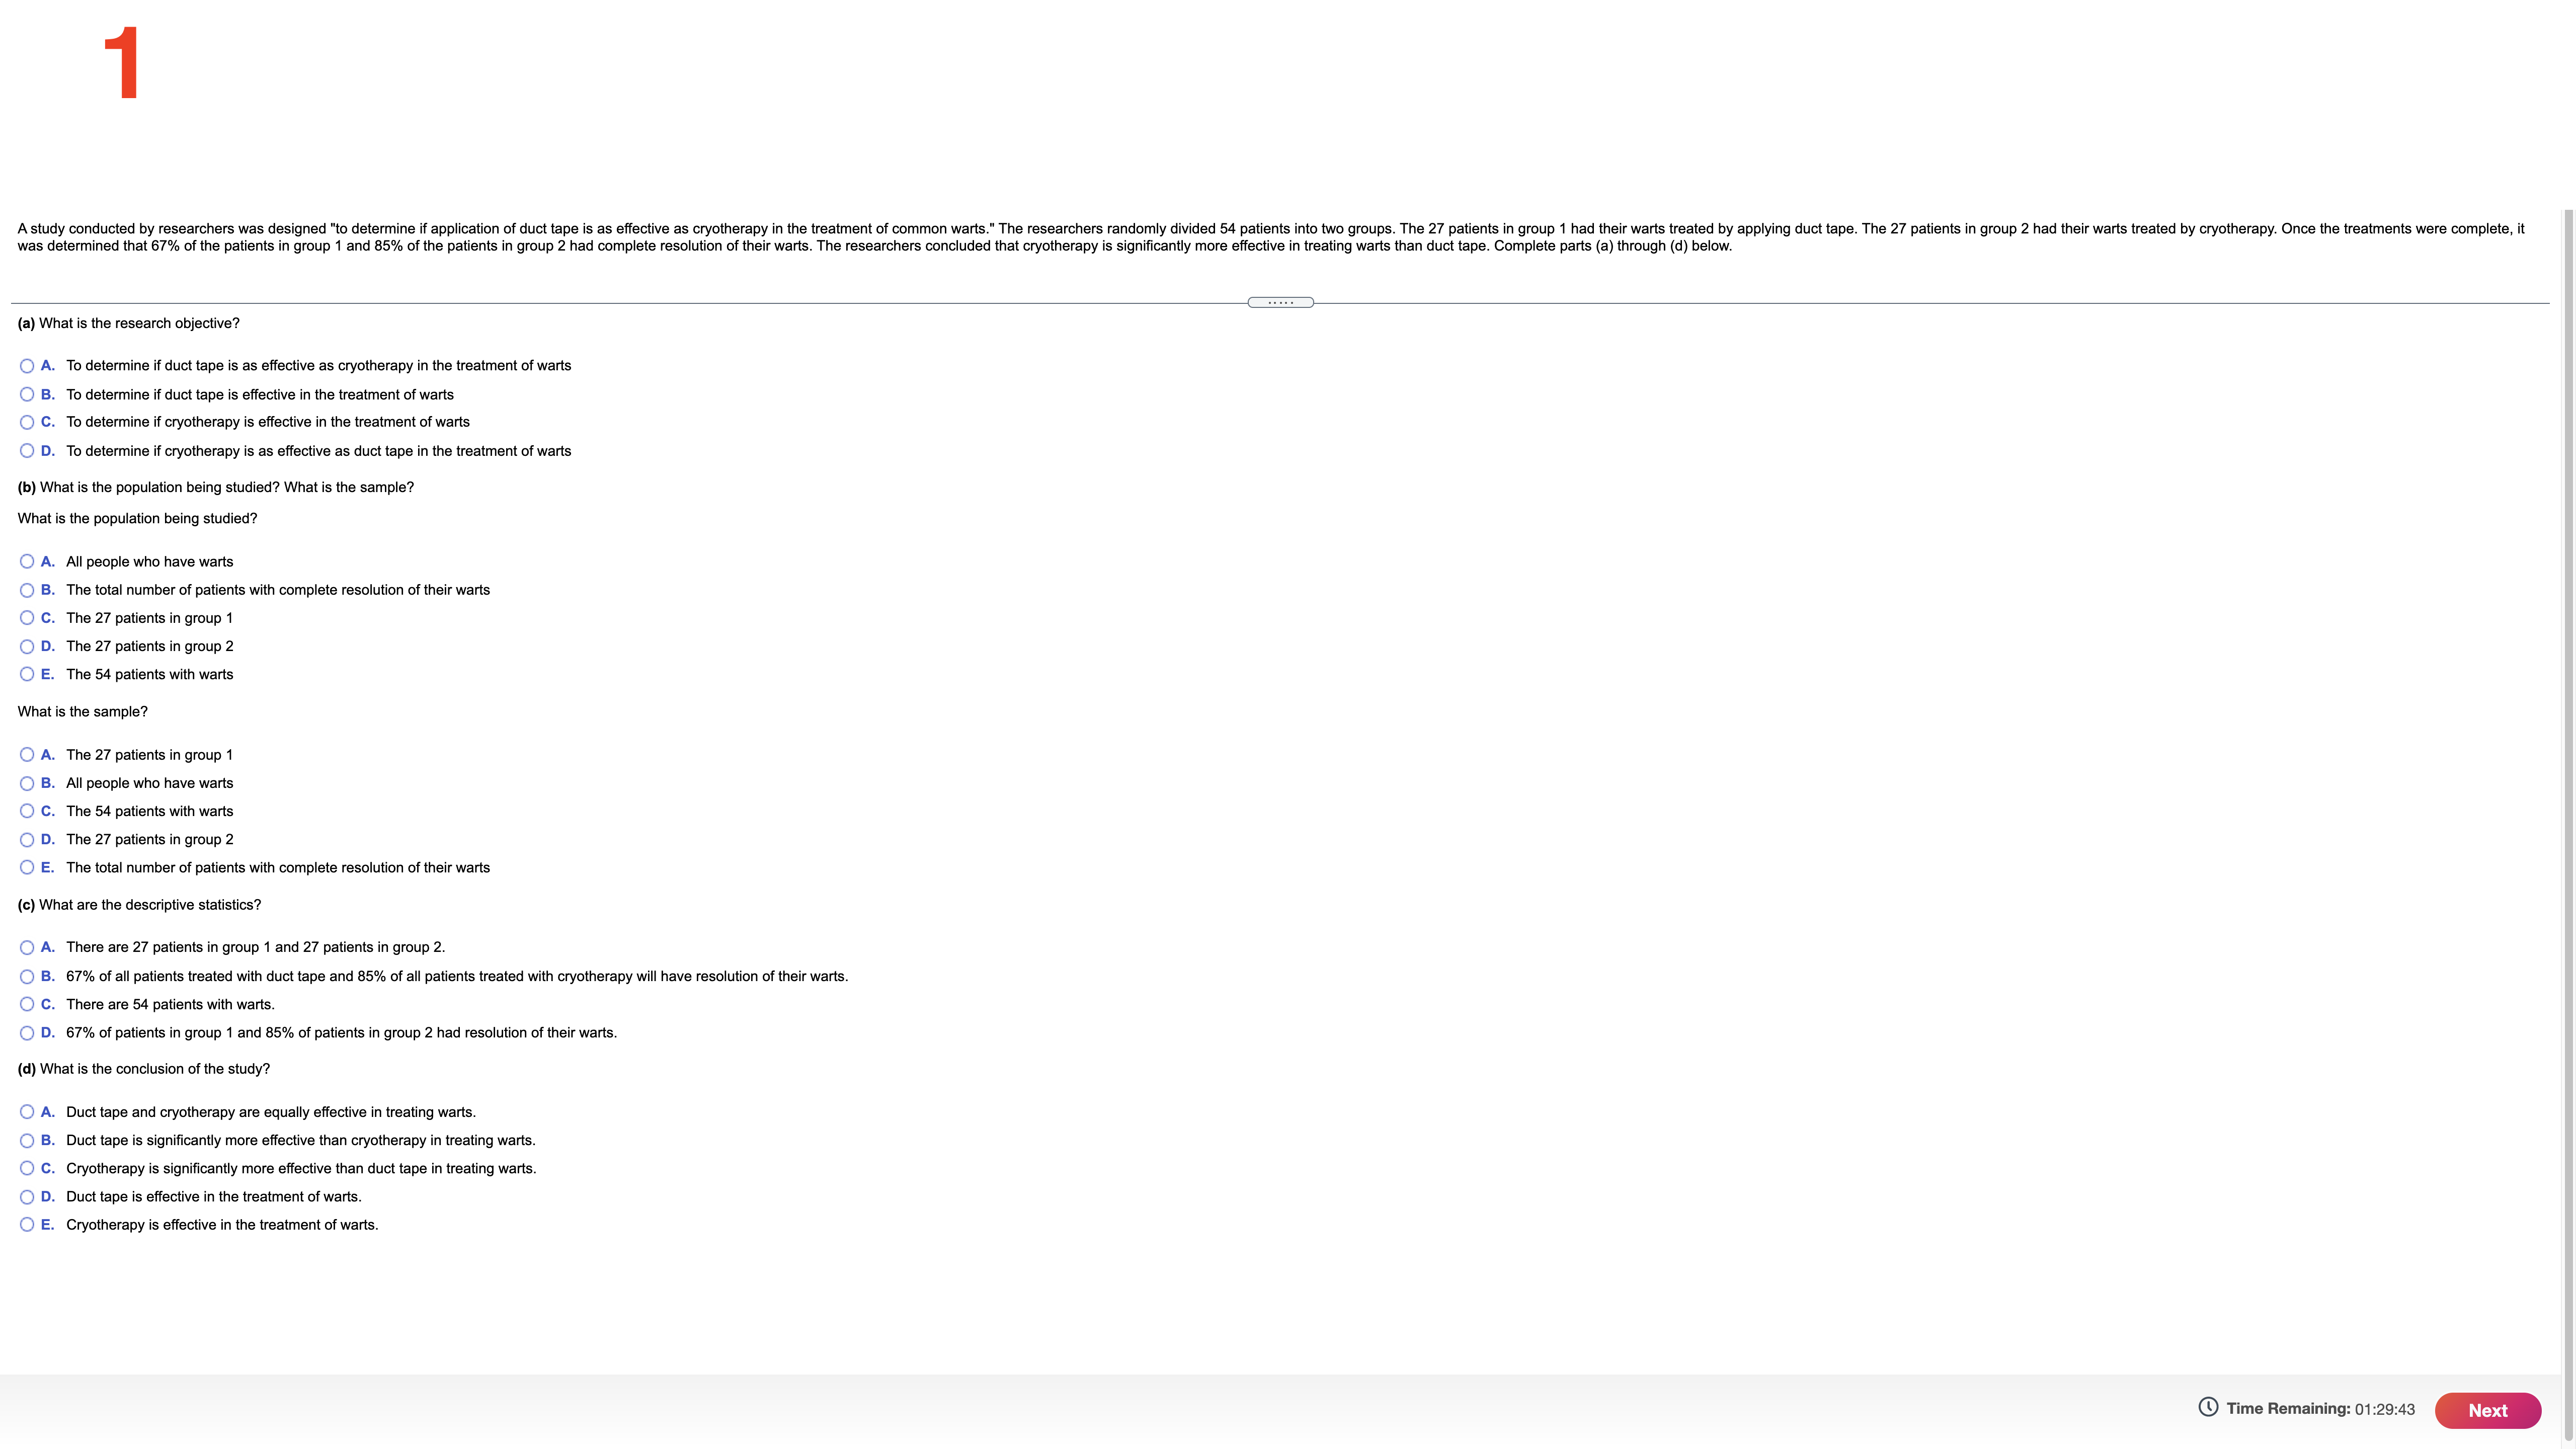
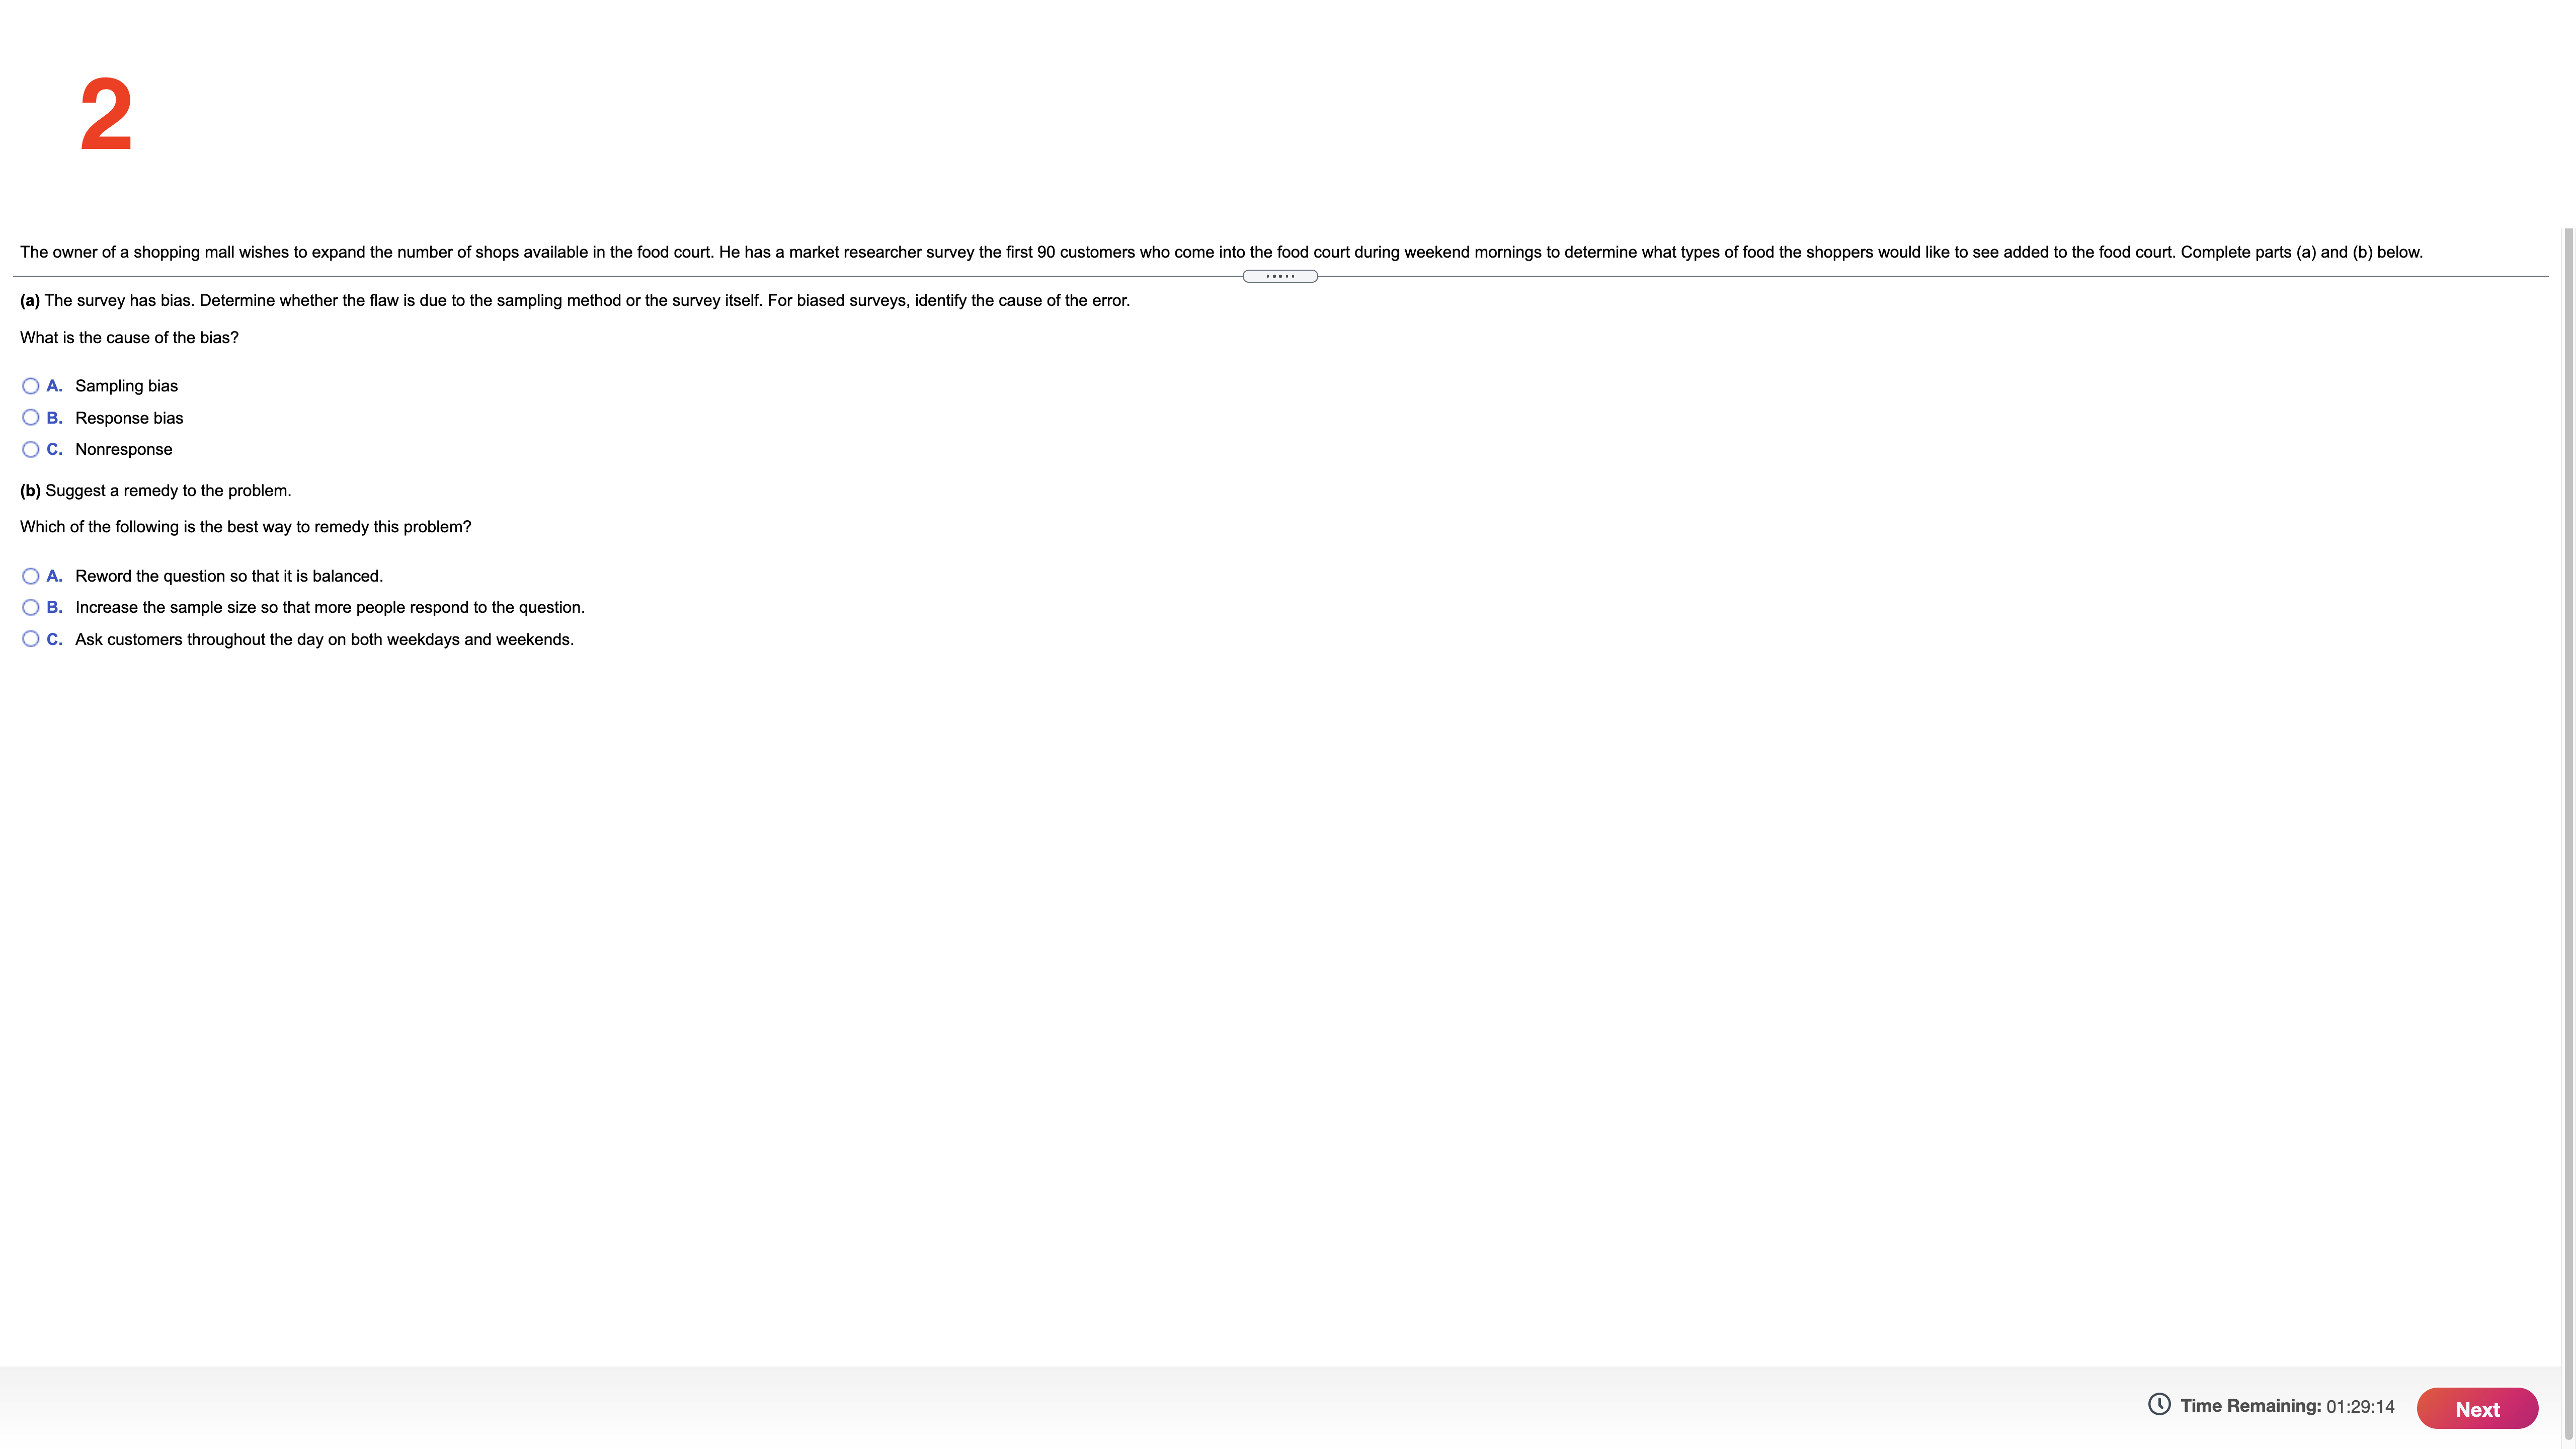
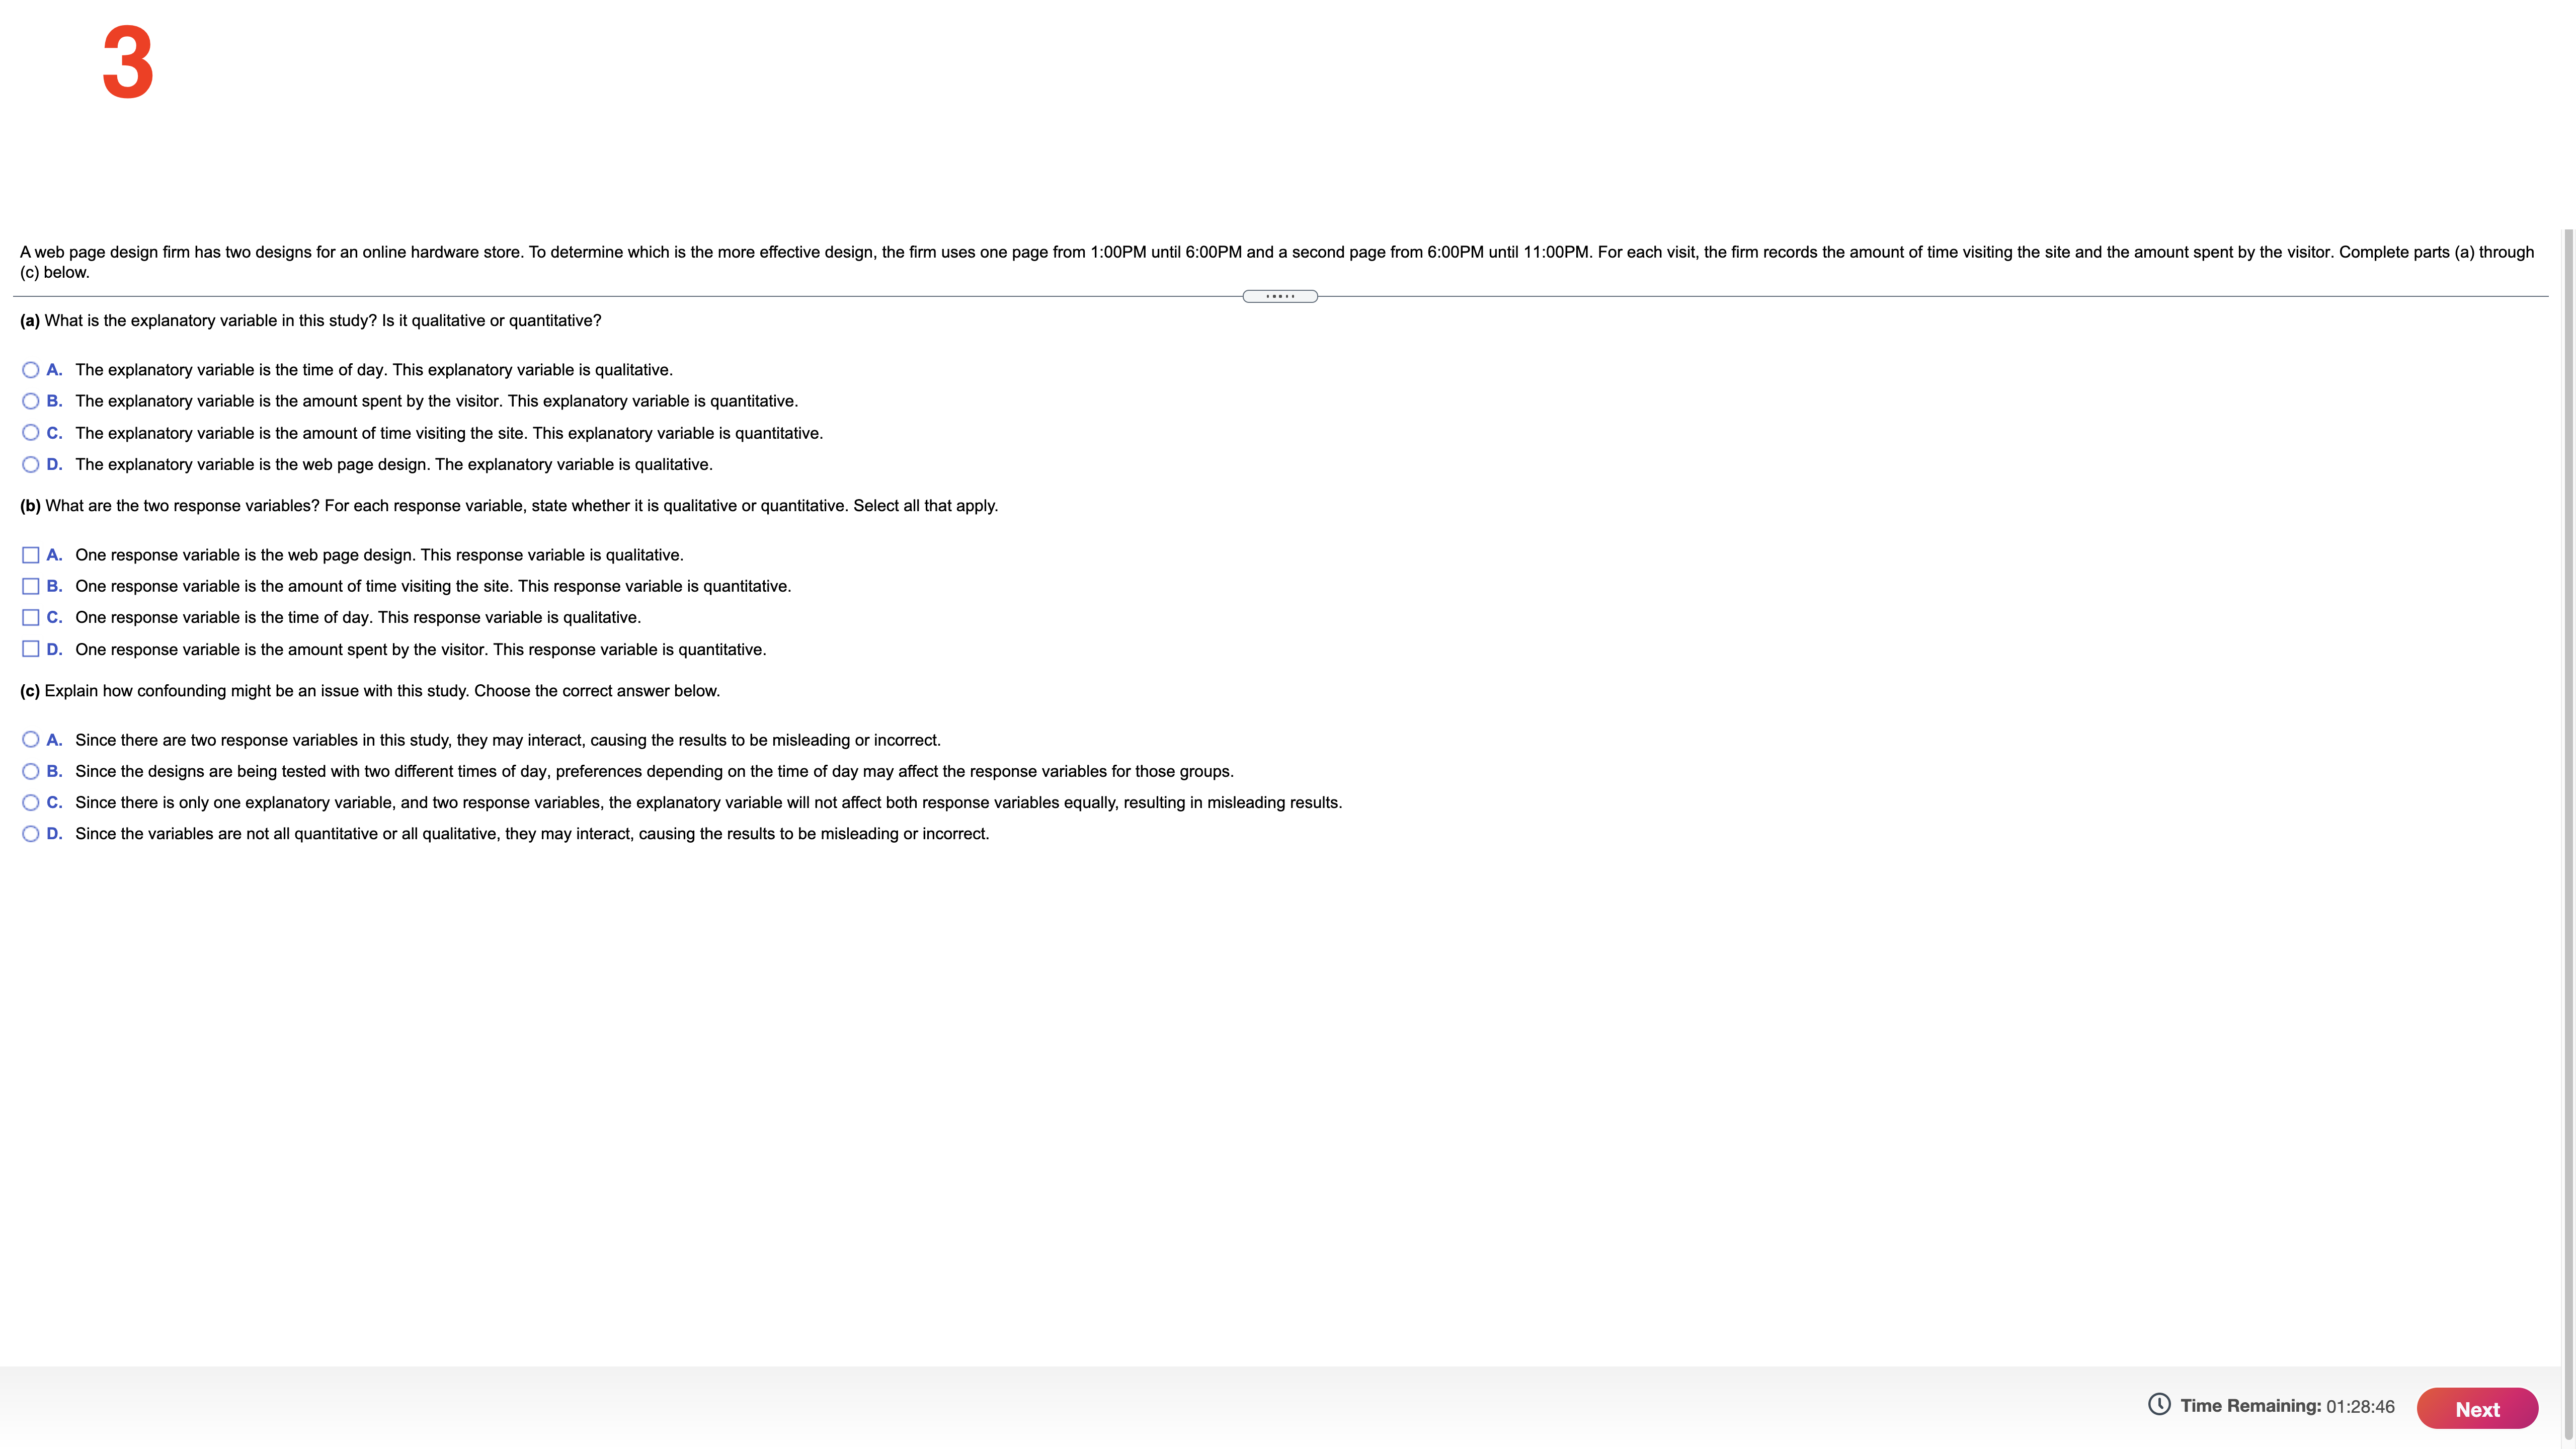
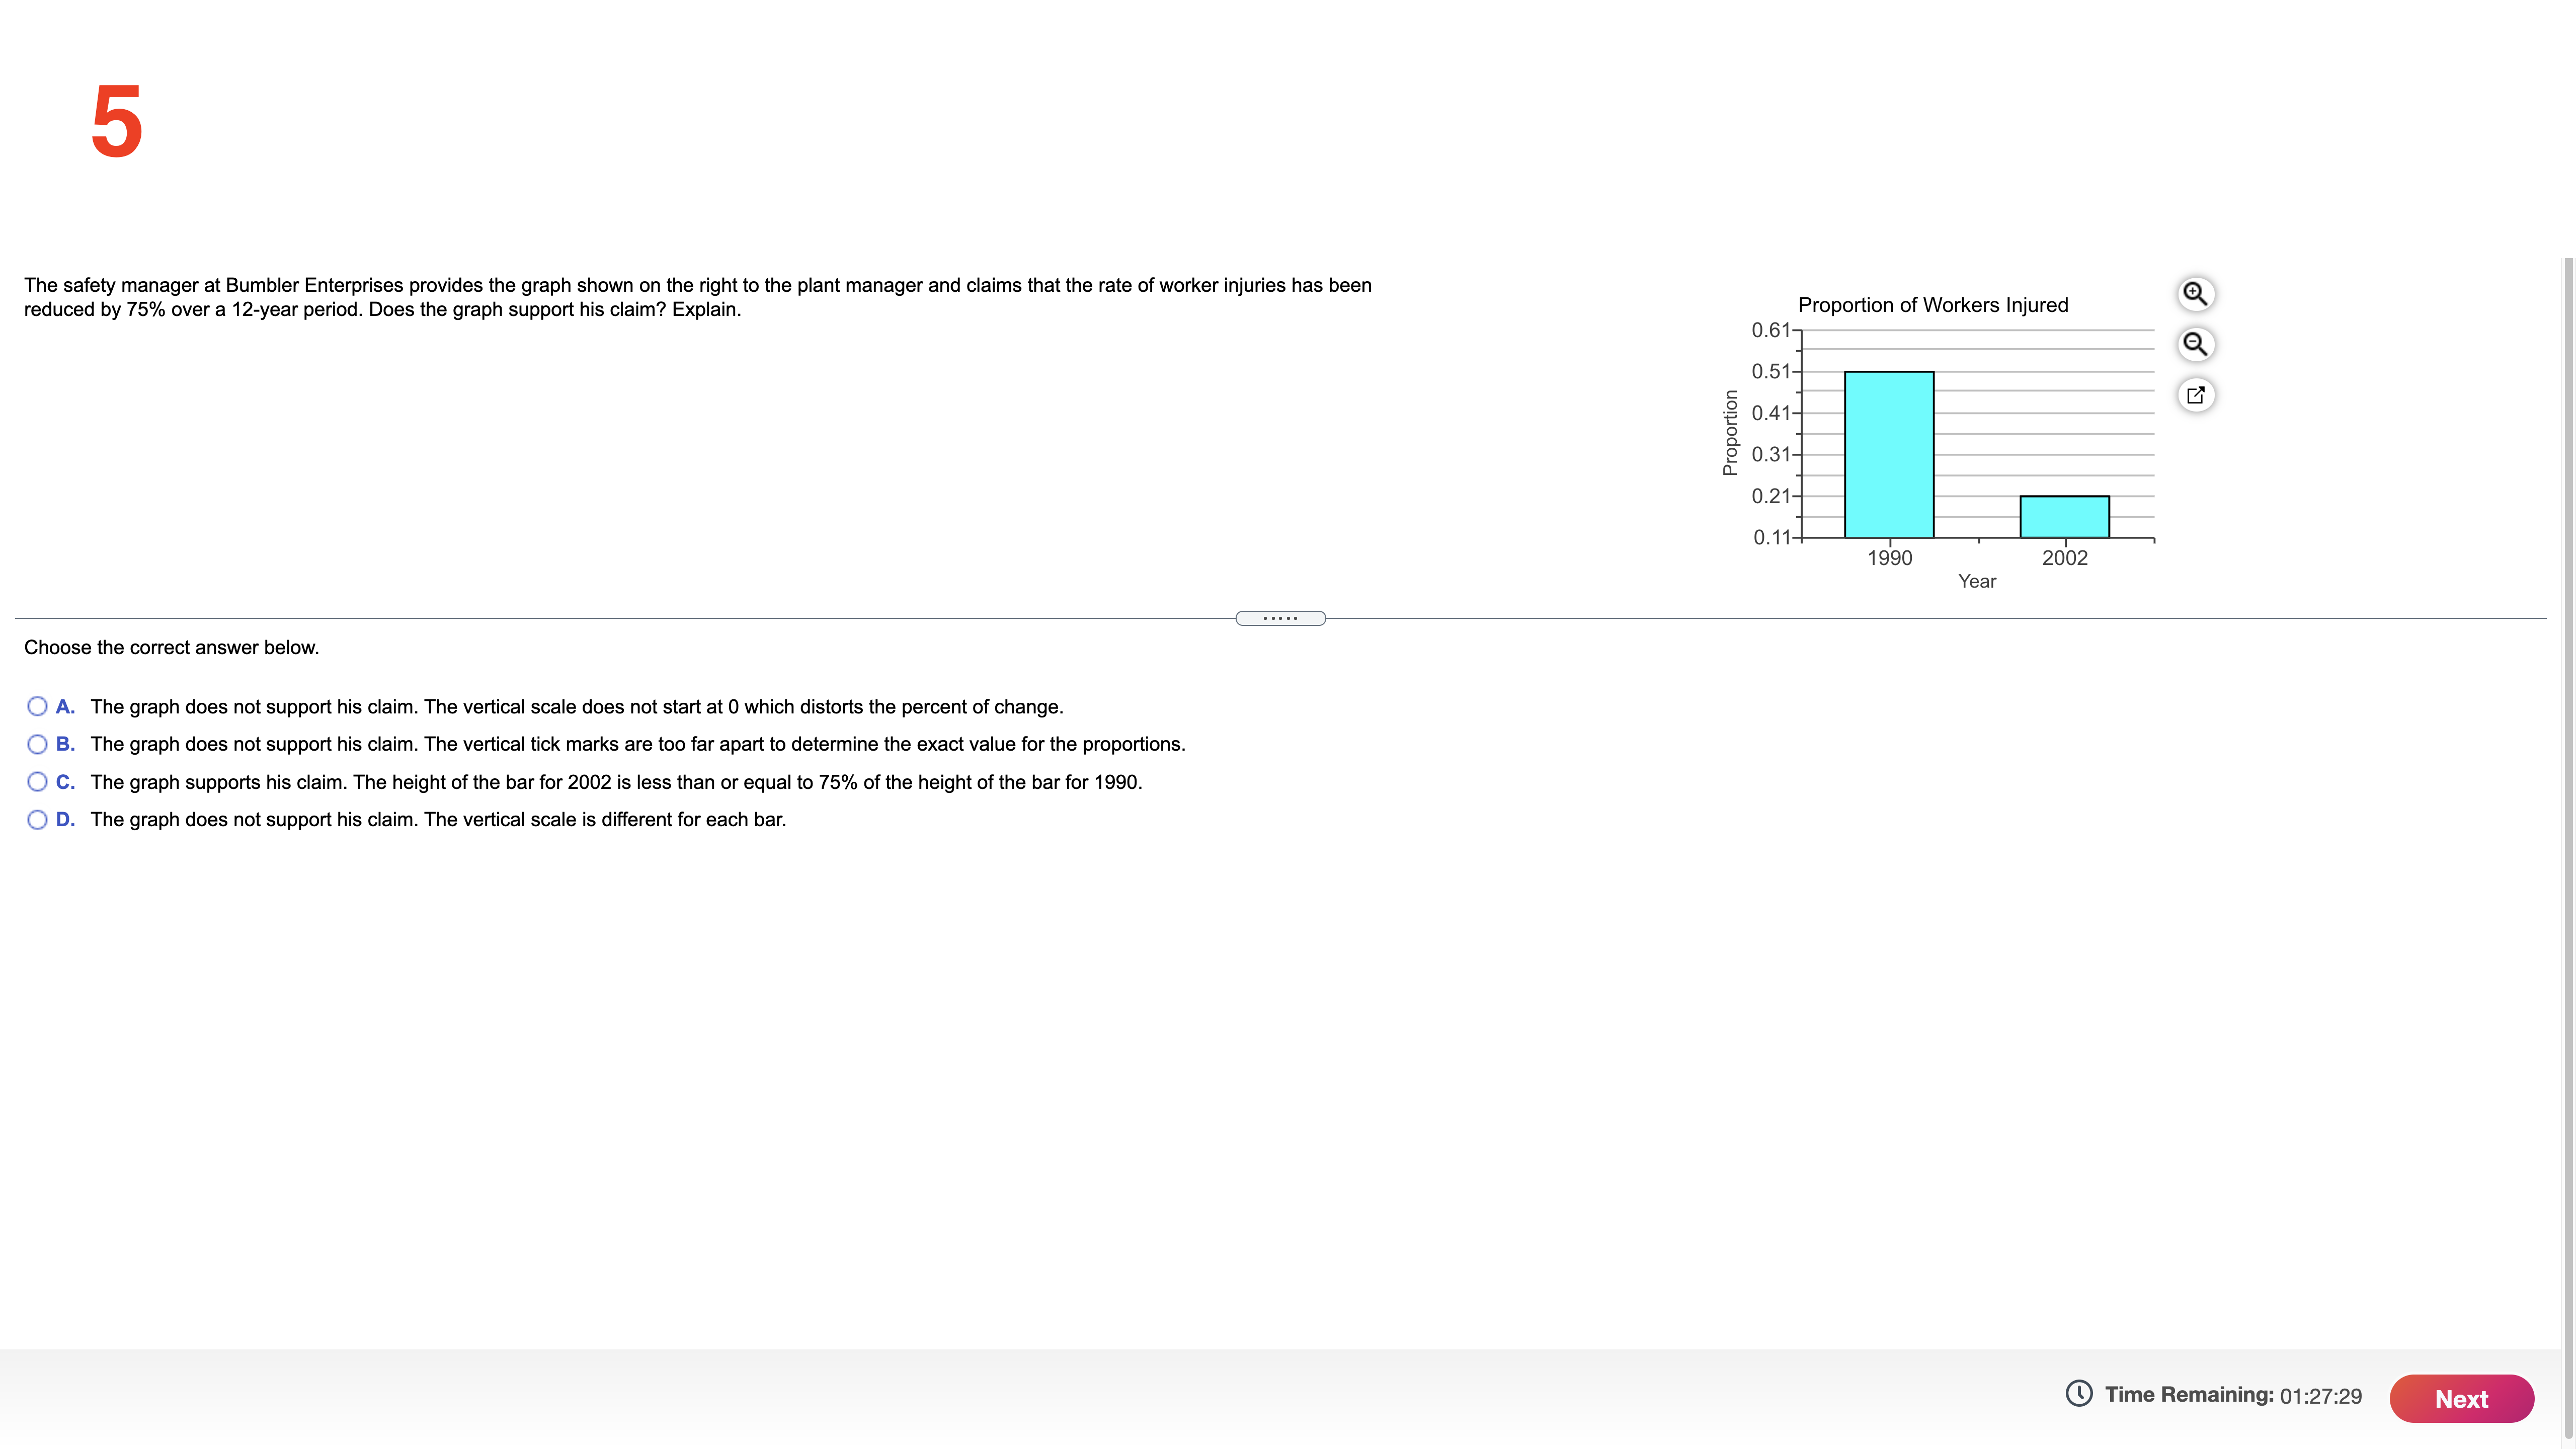
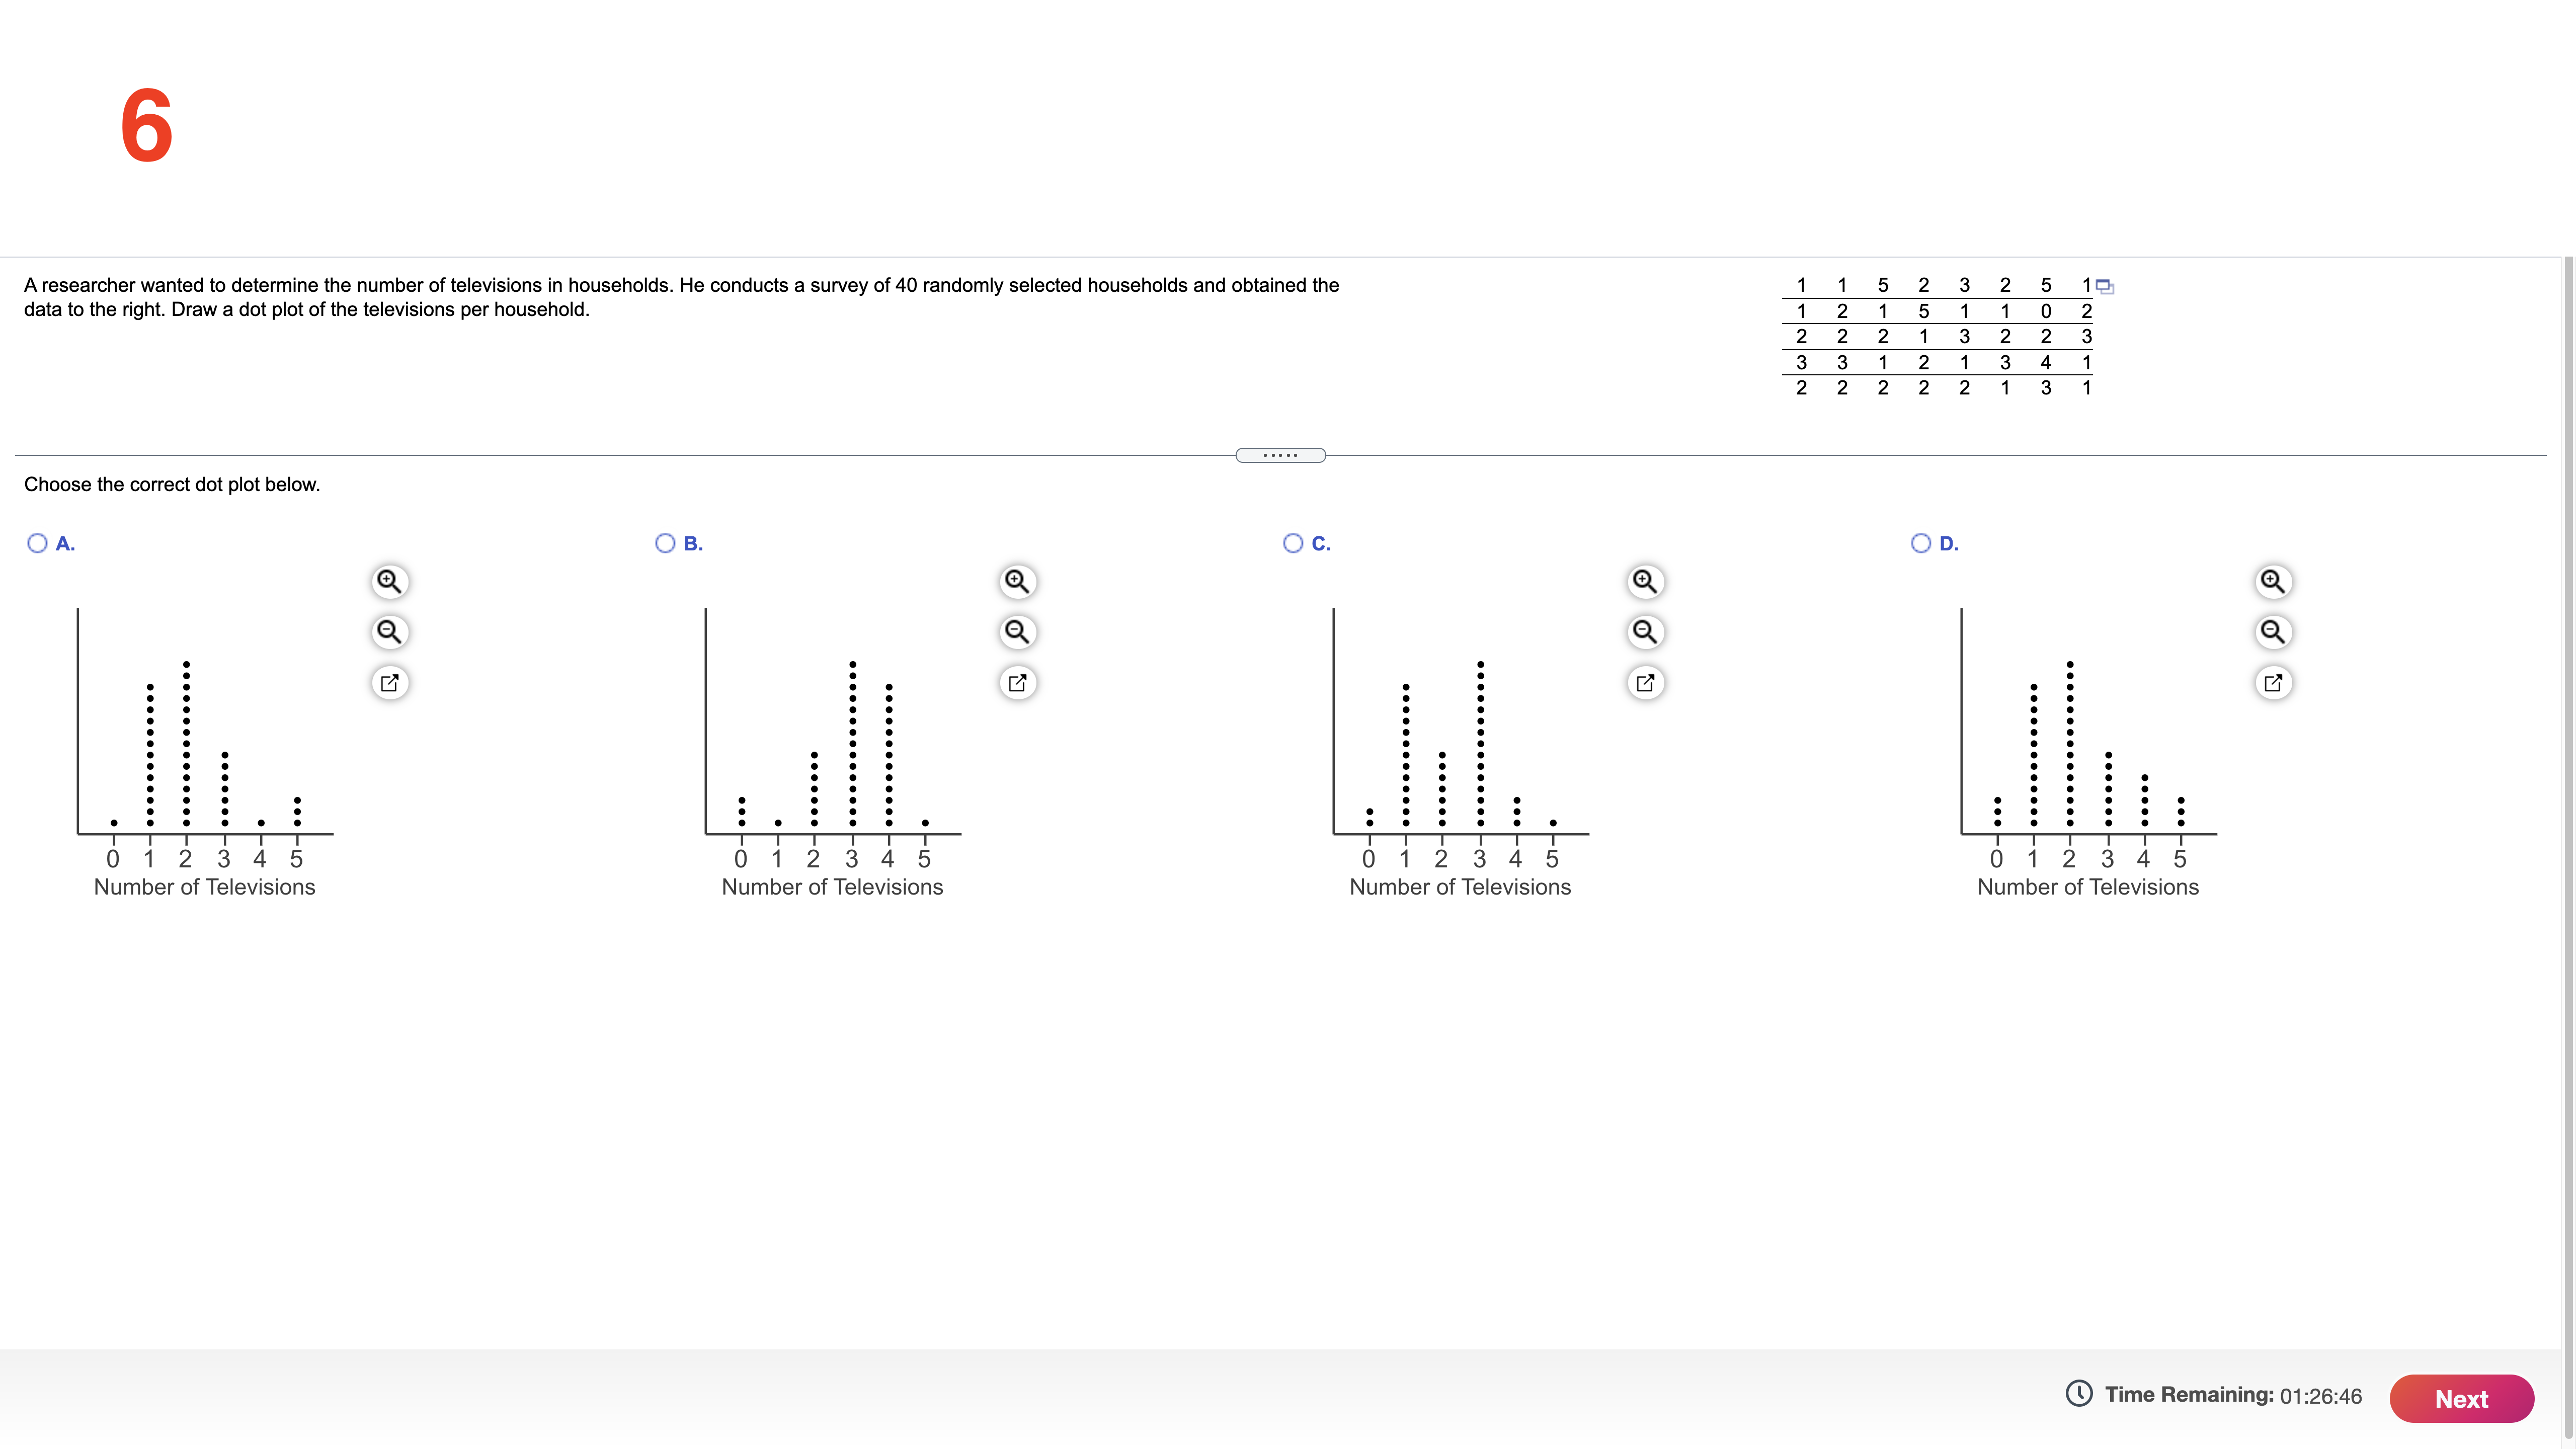
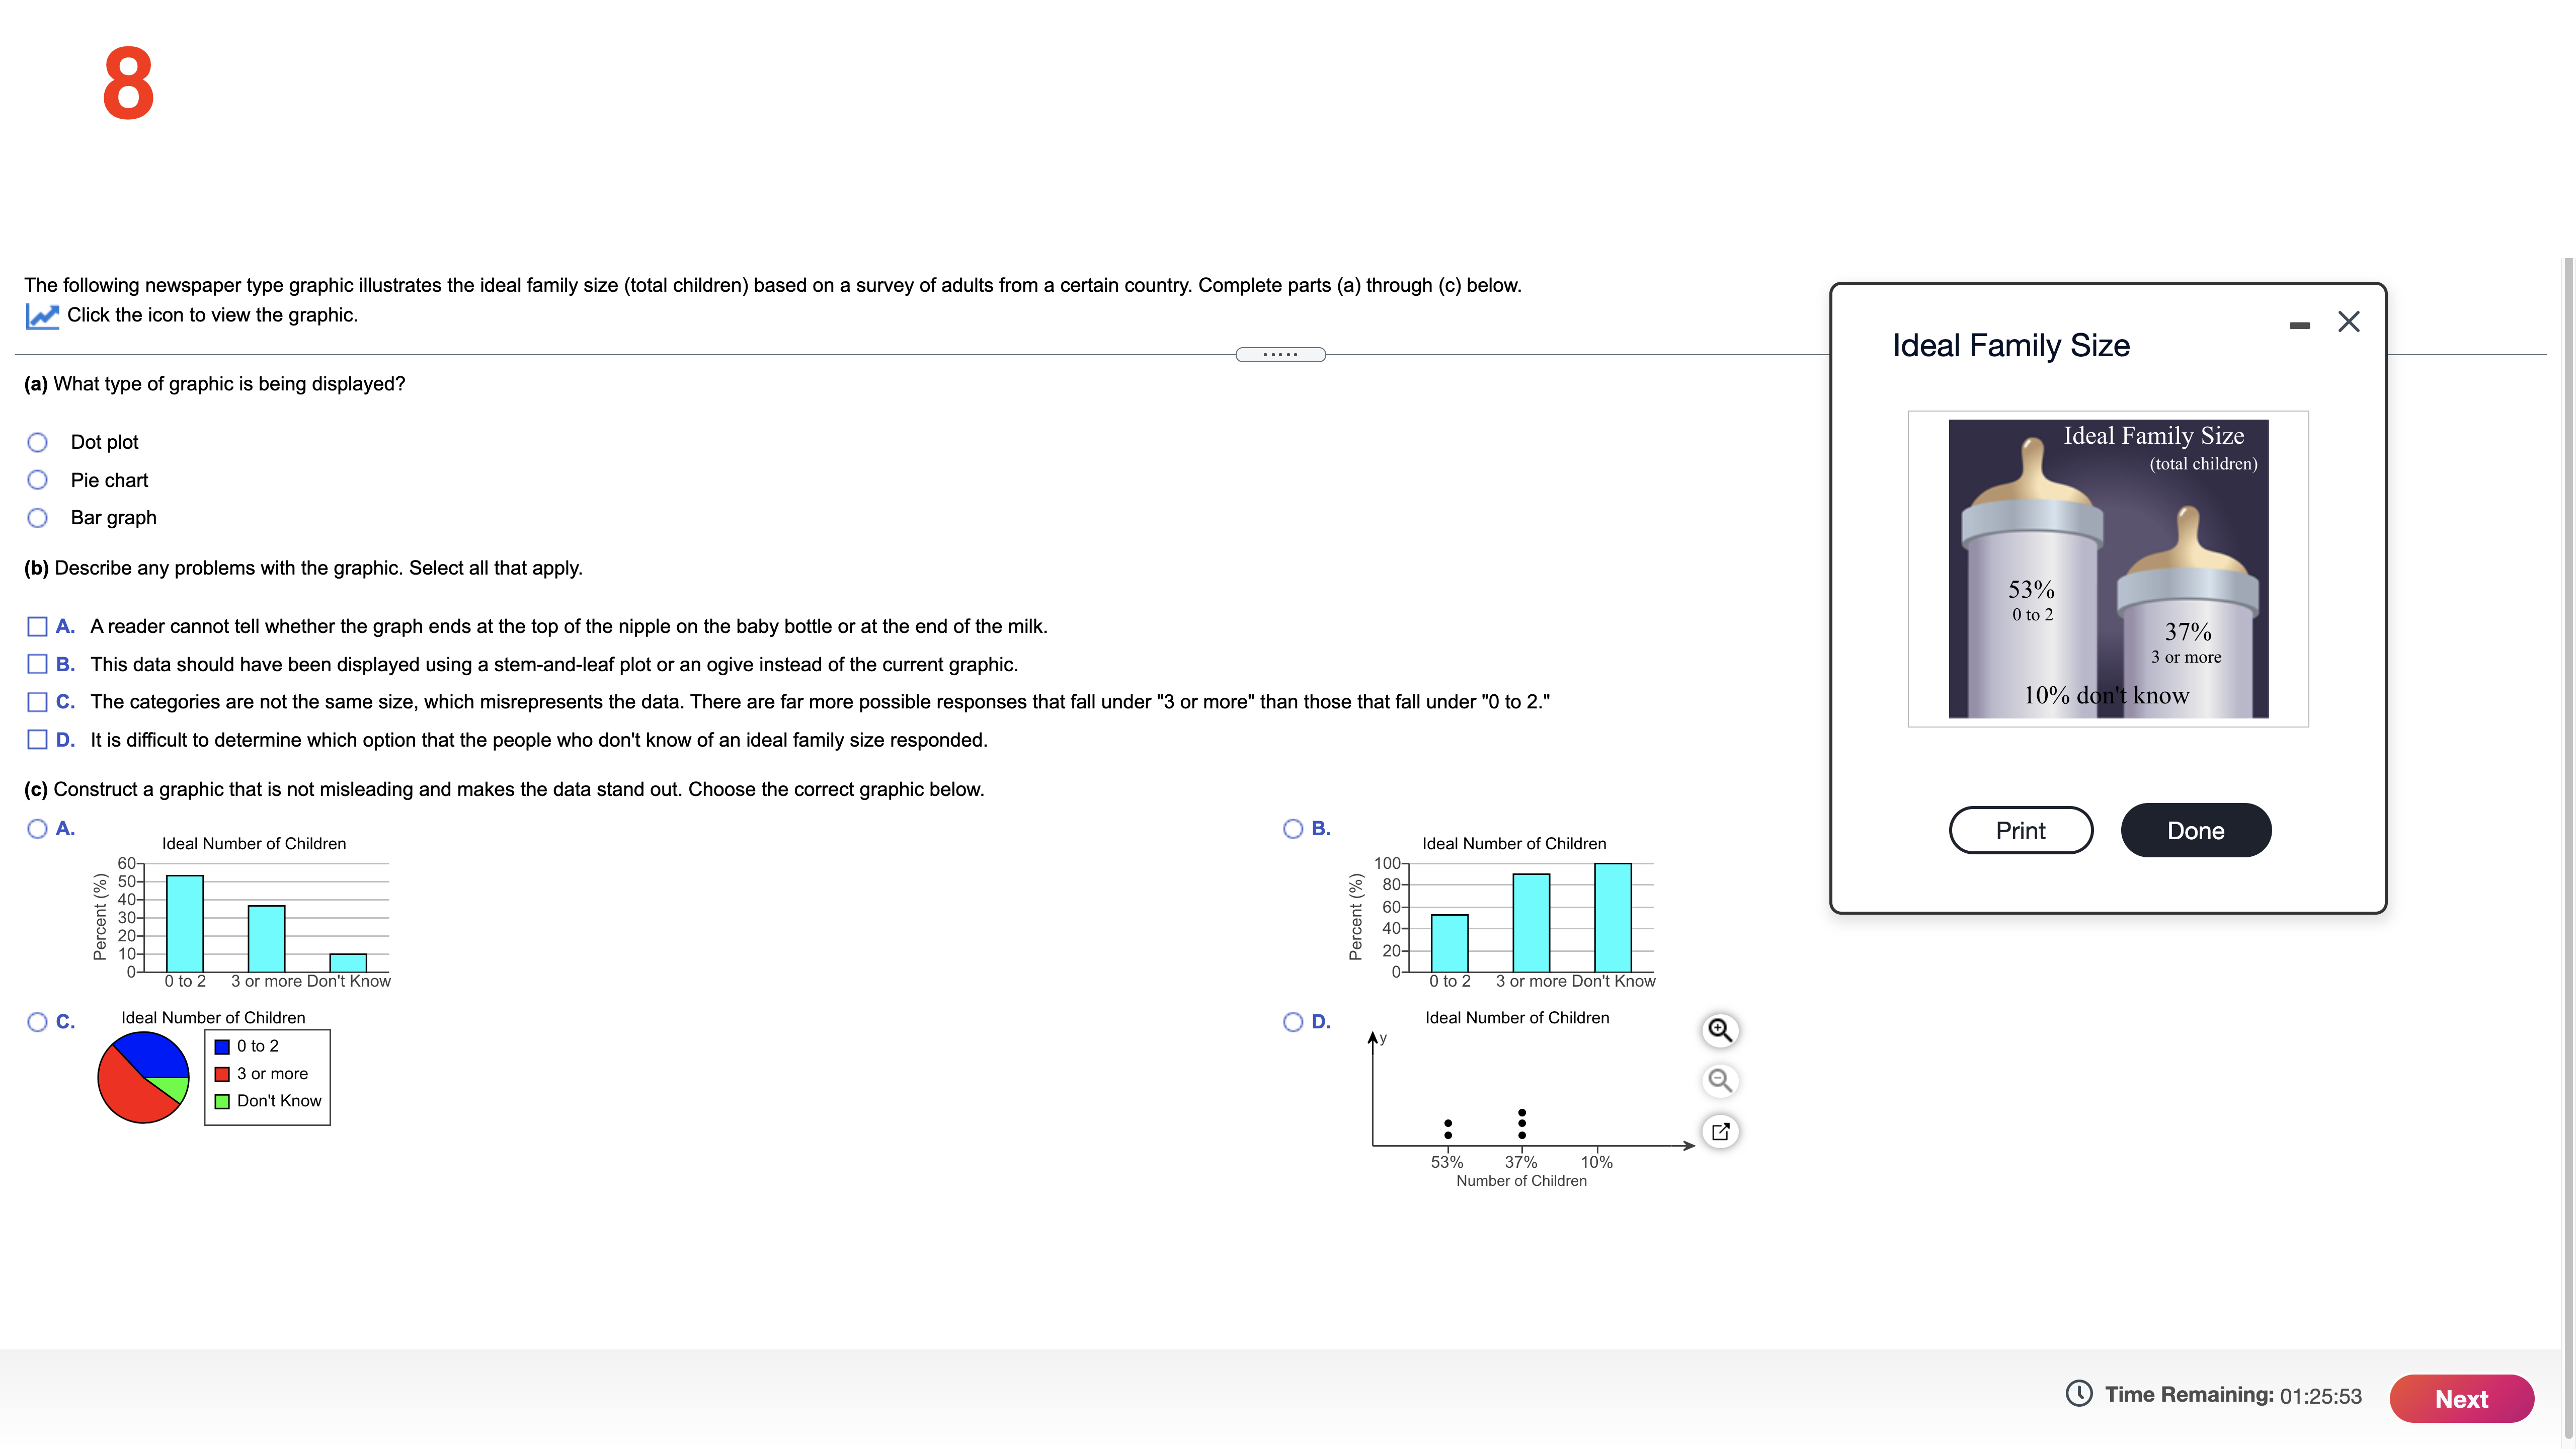
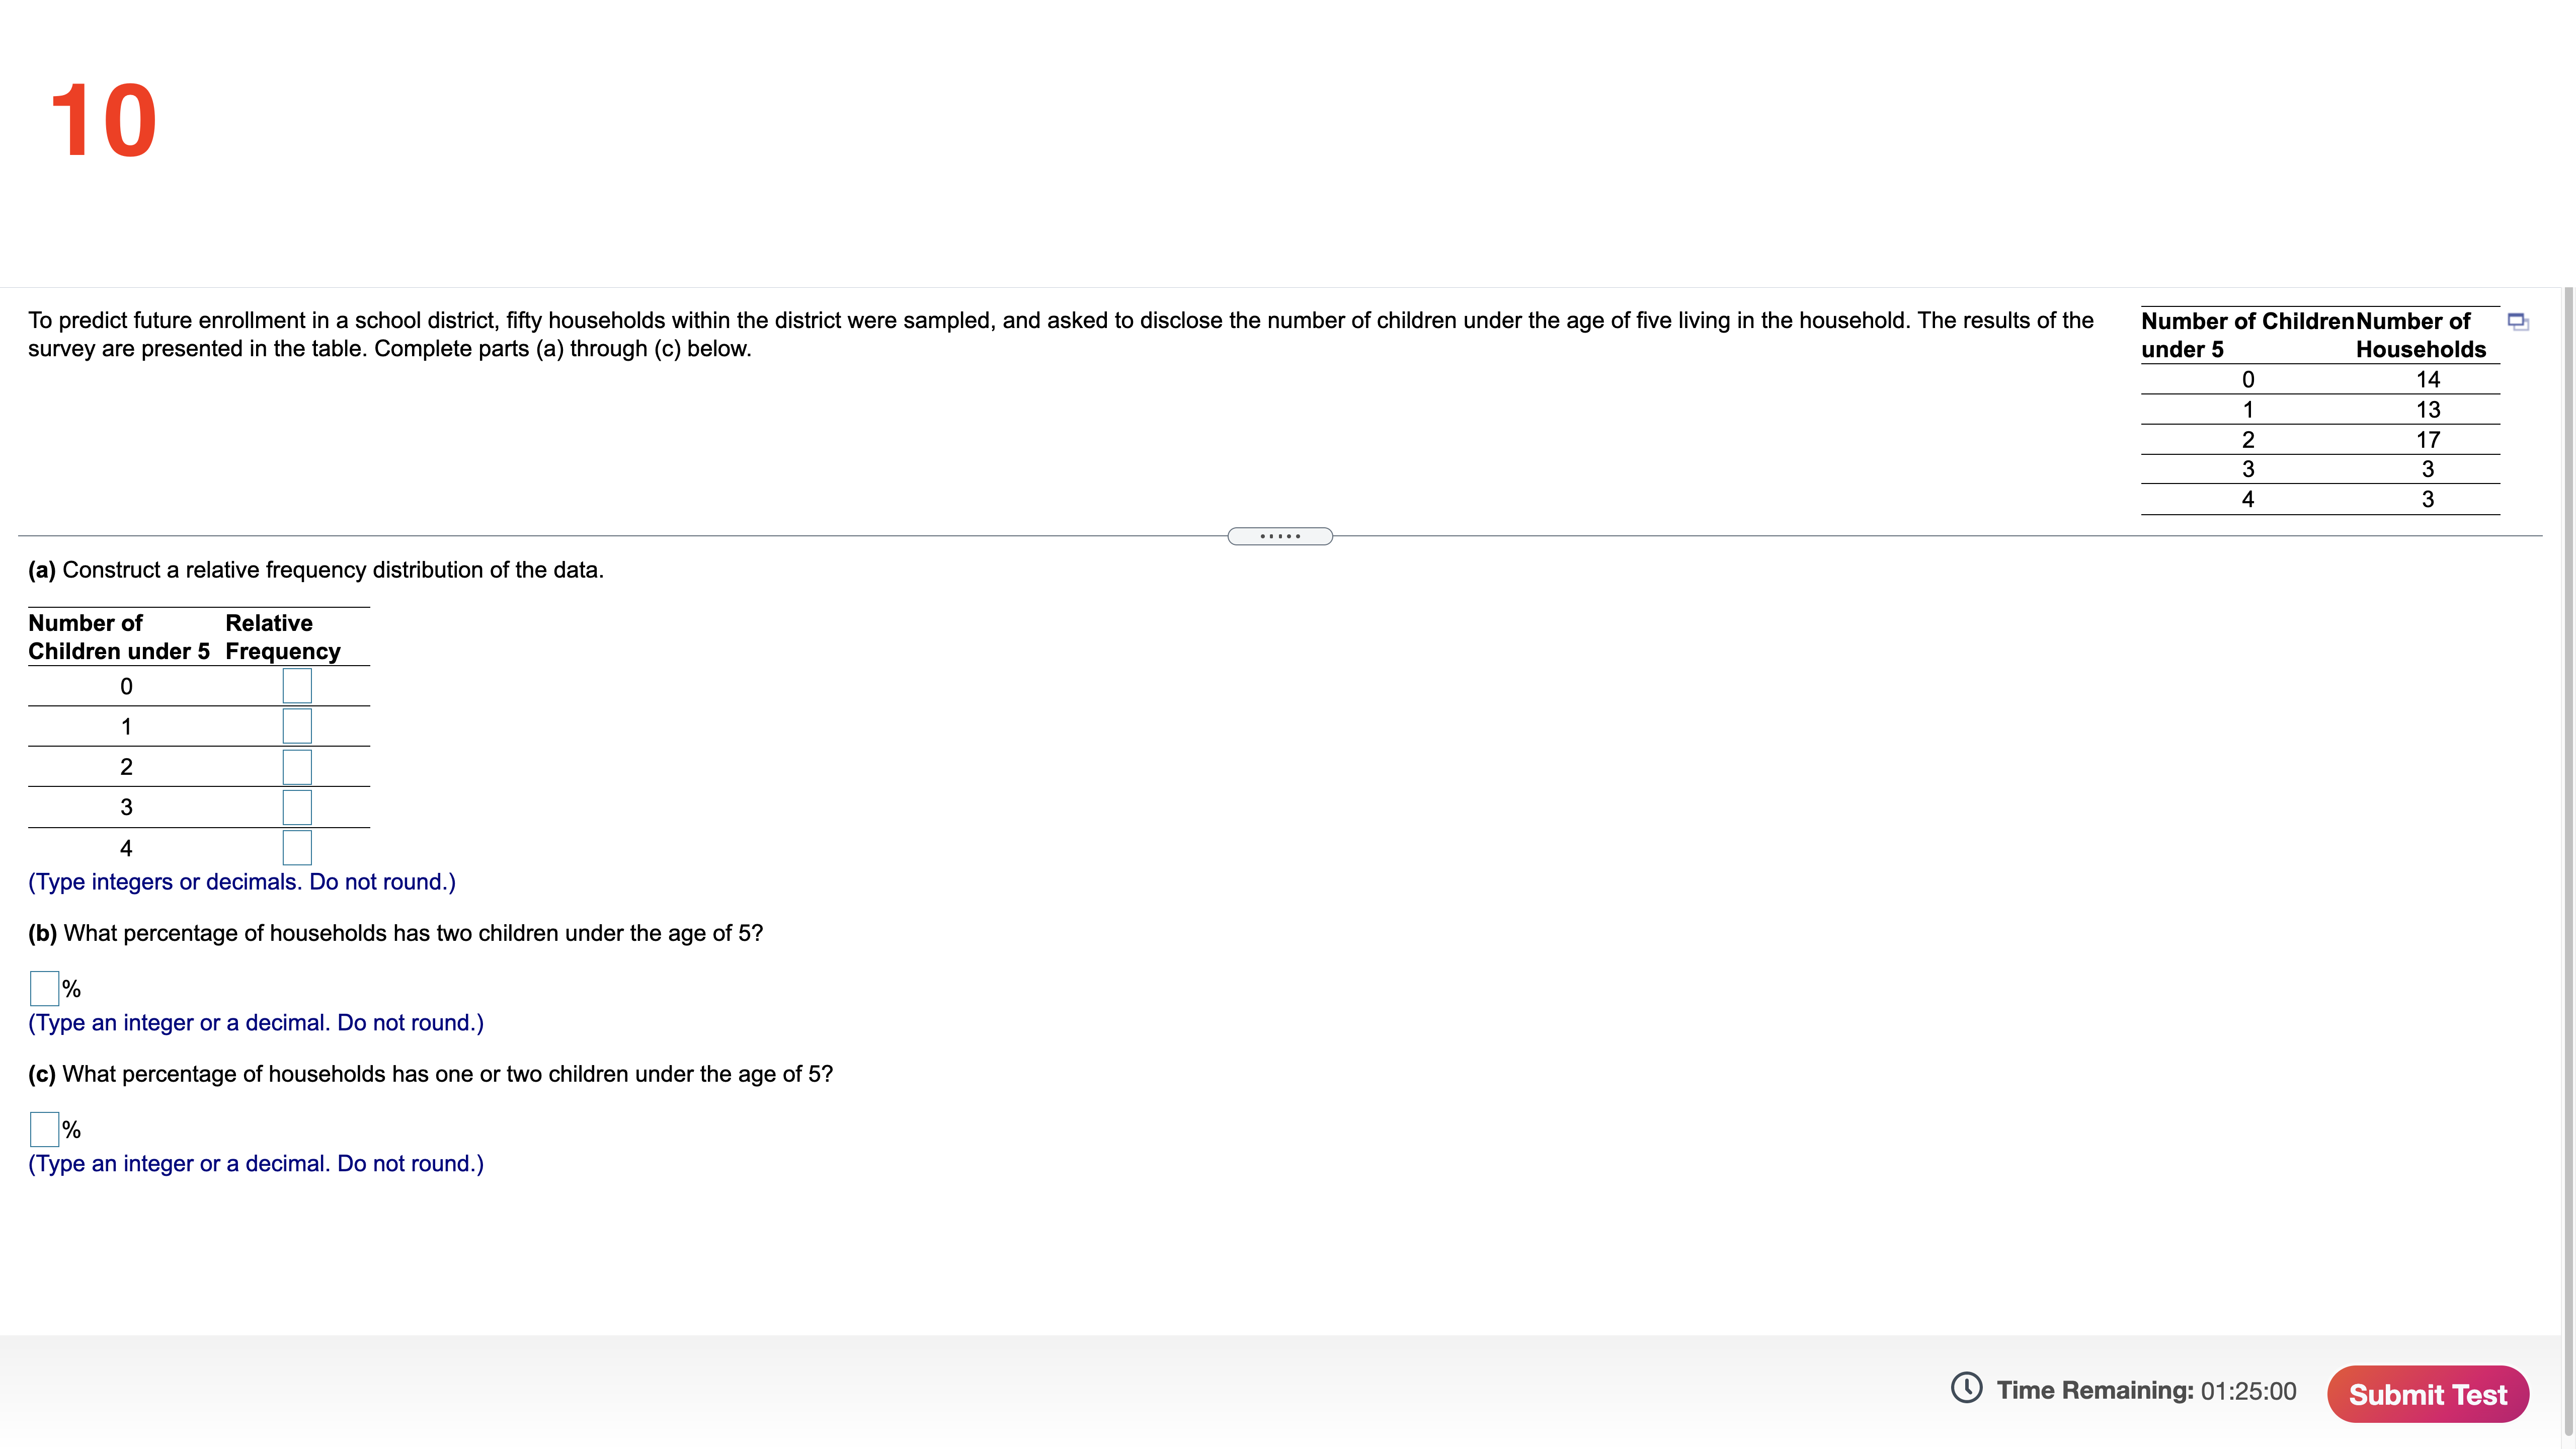
A study conducted by researchers was designed "to determine if application of duct tape is as effective as cryotherapy in the treatment of common warts." The researchers randomly divided 54 patients into two groups. The 27 patients in group 1 had their warts treated by applying duct tape. The 27 patients in group 2 had their warts treated by cryotherapy. Once the treatments were complete, it was determined that 67% of the patients in group 1 and 85% of the patients in group 2 had complete resolution of their warts. The researchers concluded that cryotherapy is significantly more effective in treating warts than duct tape. Complete parts (a) through (d) below. (a) What is the research objective? O A. To determine if duct tape is as effective as cryotherapy in the treatment of warts O B. To determine if duct tape is effective in the treatment of warts O C. To determine if cryotherapy is effective in the treatment of warts O D. To determine if cryotherapy is as effective as duct tape in the treatment of warts (b) What is the population being studied? What is the sample? What is the population being studied? O A. All people who have warts O B. The total number of patients with complete resolution of their warts O C. The 27 patients in group O D. The 27 patients in group 2 O E. The 54 patients with warts What is the sample? O A. The 27 patients in group 1 O B. All people who have warts O C. The 54 patients with warts O D. The 27 patients in group 2 O E. The total number of patients with complete resolution of their warts (c) What are the descriptive statistics? O A. There are 27 patients in group 1 and 27 patients in group 2. O B. 67% of all patients treated with duct tape and 85% of all patients treated with cryotherapy will have resolution of their warts. O C. There are 54 patients with warts. O D. 67% of patients in group 1 and 85% of patients in group 2 had resolution of their warts. (d) What is the conclusion of the study? O A. Duct tape and cryotherapy are equally effective in treating warts. O B. Duct tape is significantly more effective than cryotherapy in treating warts. O C. Cryotherapy is significantly more effective than duct tape in treating warts. O D. Duct tape is effective in the treatment of warts. O E. Cryotherapy is effective in the treatment of warts. Time Remaining: 01:29:43 Next2 The owner of a shopping mall wishes to expand the number of shops available in the food court. He has a market researcher survey the first 90 customers who come into the food court during weekend mornings to determine what types of food the shoppers would like to see added to the food court. Complete parts (a) and (b) below. (a) The survey has bias. Determine whether the flaw is due to the sampling method or the survey itself. For biased surveys, identify the cause of the error. What is the cause of the bias? O A. Sampling bias O B. Response bias O C. Nonresponse (b) Suggest a remedy to the problem. Which of the following is the best way to remedy this problem? O A. Reword the question so that it is balanced. B. Increase the sample size so that more people respond to the question. O C. Ask customers throughout the day on both weekdays and weekends. Time Remaining: 01:29:14 Next3 A web page design firm has two designs for an online hardware store. To determine which is the more effective design, the firm uses one page from 1:00PM until 6:00PM and a second page from 6:00PM until 11:00PM. For each visit, the firm records the amount of time visiting the site and the amount spent by the visitor. Complete parts (a) through (c) below. (a) What is the explanatory variable in this study? Is it qualitative or quantitative? O A. The explanatory variable is the time of day. This explanatory variable is qualitative. O B. The explanatory variable is the amount spent by the visitor. This explanatory variable is quantitative. O C. The explanatory variable is the amount of time visiting the site. This explanatory variable is quantitative. O D. The explanatory variable is the web page design. The explanatory variable is qualitative (b) What are the two response variables? For each response variable, state whether it is qualitative or quantitative. Select all that apply. A. One response variable is the web page design. This response variable is qualitative. B. One response variable is the amount of time visiting the site. This response variable is quantitative. C. One response variable is the time of day. This response variable is qualitative. D. One response variable is the amount spent by the visitor. This response variable is quantitative. (c) Explain how confounding might be an issue with this study. Choose the correct answer below. O A. Since there are two response variables in this study, they may interact, causing the results to be misleading or incorrect. O B. Since the designs are being tested with two different times of day, preferences depending on the time of day may affect the response variables for those groups. O C. Since there is only one explanatory variable, and two response variables, the explanatory variable will not affect both response variables equally, resulting in misleading results. O D. Since the variables are not all quantitative or all qualitative, they may interact, causing the results to be misleading or incorrect. Time Remaining: 01:28:46 Next5 The safety manager at Bumbler Enterprises provides the graph shown on the right to the plant manager and claims that the raw of worker injuries has been reduced by 75% over a 12-year period. Does the graph support his claim? Explain. Proportion 0' Workers Injured 0.61- 0.51 0.41 0.31 Proportion 0.21 0.1 1 1 990 2002 Year Choose the correct answer below. 0 A. The graph does not support his claim. The vertical scale does nut start at 0 which distorts the percent of change. 0 B. The graph does not support his claim. The vertical tick marks are too far apart to determine the exact value for the praportions. O c. The graph suppuns his claim. The height of the bar for 2002 is less than or equal to 75% of the height ofthe bar tor 1990. O D. The graph does not support his claim. The vertical scale is different for each bar Time Remaining: 01:27:29 m DA. . . . . . . . ..... 6 Choose the correct dot plot below. Number of Televisions 1 2 3 4 5 -. . . . ... data to the right. Draw a dot plot of the televisions per household O B. A researcher wanted to determine the number of televisions in households. He conducts a survey of 40 randomly selected households and obtained the . . . . . . . ... 1 2 3 4 Number of Televisions -.. . . . . . . . . ..... . . . 5 O c. . . O . . . . . . . . . .... . . . . . .. Number of Televisions 1 2 3 4 . . . . . . . . . . ..... . .. 5 N W N - - N W N N - N - N J U NN JOIN OD. N - W - W -. . . O - W N - N . . . . . . . . . .... 1 2 W ANOUT . . . . . . . . . ...... Number of Televisions "-.. . . . . . 4 -. . . .. on -. .. Time Remaining: 01:26:46 Next8 The following newspaper type graphic illustrates the ideal family size (total children) based on a survey of adults from a certain country. Complete parts (a) through (c) below. Click the icon to view the graphic. - X Ideal Family Size (a) What type of graphic is being displayed? O Dot plot deal Family Size (total children) Pie chart Bar graph (b) Describe any problems with the graphic. Select all that apply. 53% 0 to 2A. A reader cannot tell whether the graph ends at the top of the nipple on the baby bottle or at the end of the milk. 37% B. This data should have been displayed using a stem-and-leaf plot or an ogive instead of the current graphic 3 or more C. The categories are not the same size, which misrepresents the data. There are far more possible responses that fall under "3 or more" than those that fall under "0 to 2." 10% dor know D. It is difficult to determine which option that the people who don't know of an ideal family size responded. (c) Construct a graphic that is not misleading and makes the data stand out. Choose the correct graphic below. A. O B. Print Done Ideal Number of Ideal Number of Children 607 100 50- 40- . 80 4 30- 60- 20- 40- 10- 20- 0 to 2 23 or more Don't Know 0 to 2 3 or more Don't Know O C. Ideal Number of Children OD. Ideal Number of Children 0 to 2 Ay 3 or more O Don't Know . 53% 37% 10% Number of Children Time Remaining: 01:25:53 Next10 To predict future enrollment in a school district, fty households within the district were sampled, and asked to disclose the number of children under the age of ve living in the household. The results of the Number of childrenNumber of Q1 survey are presented in the table. Complete parts (a) through (c) below. under 5 Households 1 4 1 3 1 7 3 3 bwmao (a) Construct a relative frequency distribution of the data. Number of Relative Children under 5 Frequency 0 1 2 3 4 (Type integers or decimals. Do not round.) (b) What percentage of households has two children under the age of 5'! % (Type an integer or a decimal. Do not round.) (c) What percentage of households has one or two children under the age of 5? % (Type an integer or a decimal. Do not round.) Time Remaining: 01:25:00 Submit Test
Step by Step Solution
There are 3 Steps involved in it

Get step-by-step solutions from verified subject matter experts