Question
Need help with the following. Have done some but need to see if it is correct and help with some. Please follow the links. For
Need help with the following. Have done some but need to see if it is correct and help with some. Please follow the links.
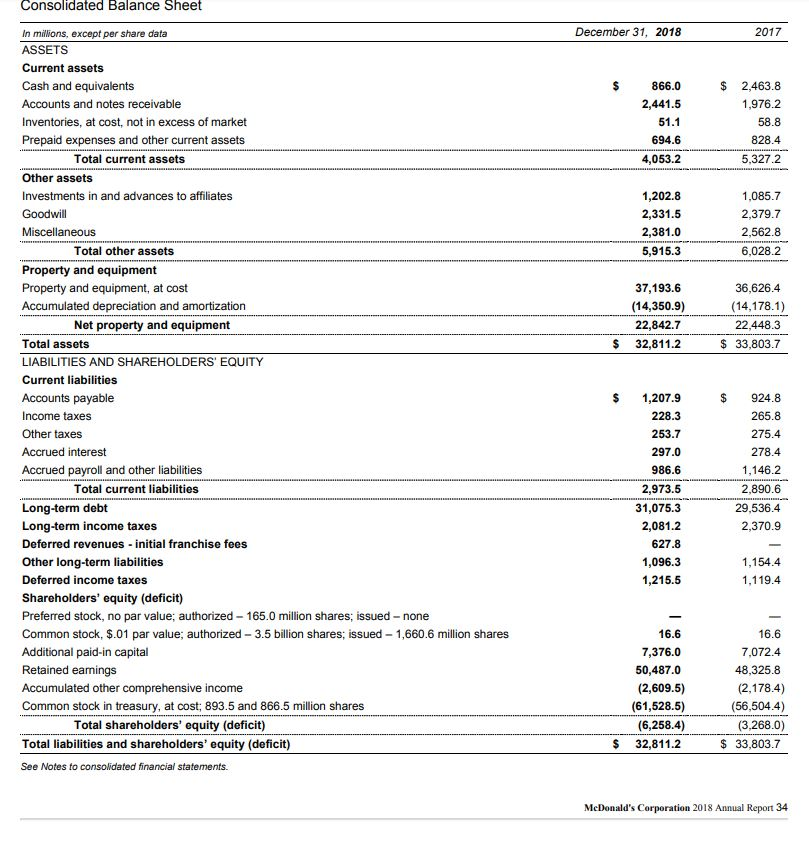
For McDONALD'S 2018 2017 financial report, please see the following:
6. Inventory Turnover: Cost of goods sold/ average inventory
2018:
2017:
7. Number of Days Sales in Inventory: Average inventory / average daily Cost of goods Sold
2018:
2017:
8. Fixed Assets to Long-term Liabilities: Fixed assets (net)/ Long term liabilities
2018: $#,###/$##,### = #.##
2017: $#,###/$##,### = #.##
9. Liabilities to Stockholders Equity: Total liabilities / total stockholders equity
2018:= #.##
2017: = #.##
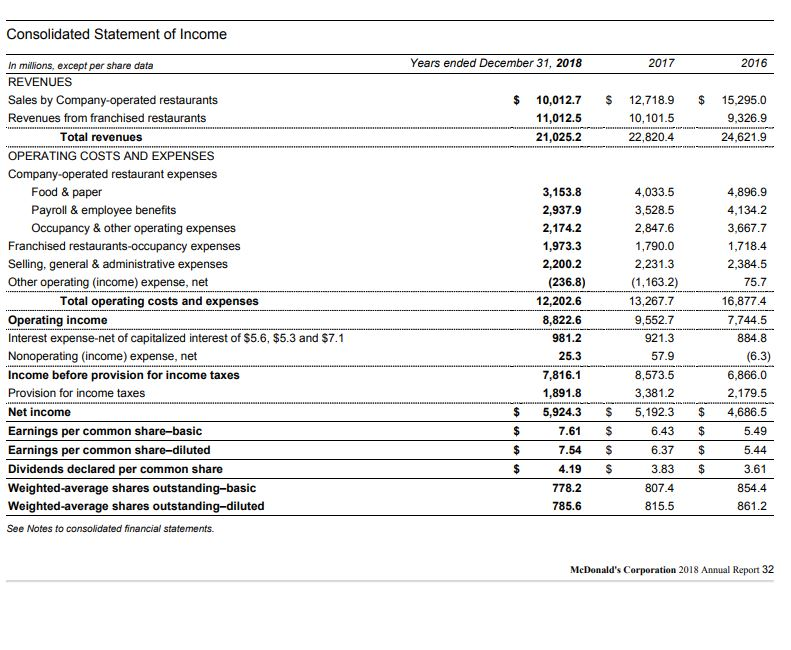
10. Times Interest Earned: (Income before income tax + interest expense) / interest expense
2018: $#,###/$##,### = #.##
2017: $#,###/$##,### = #.##
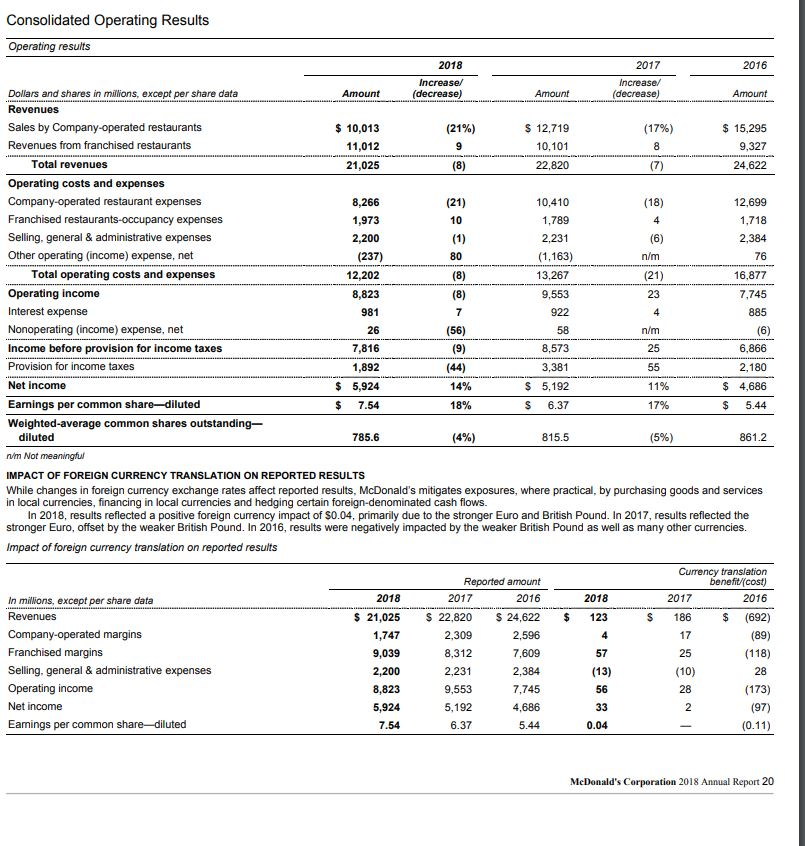
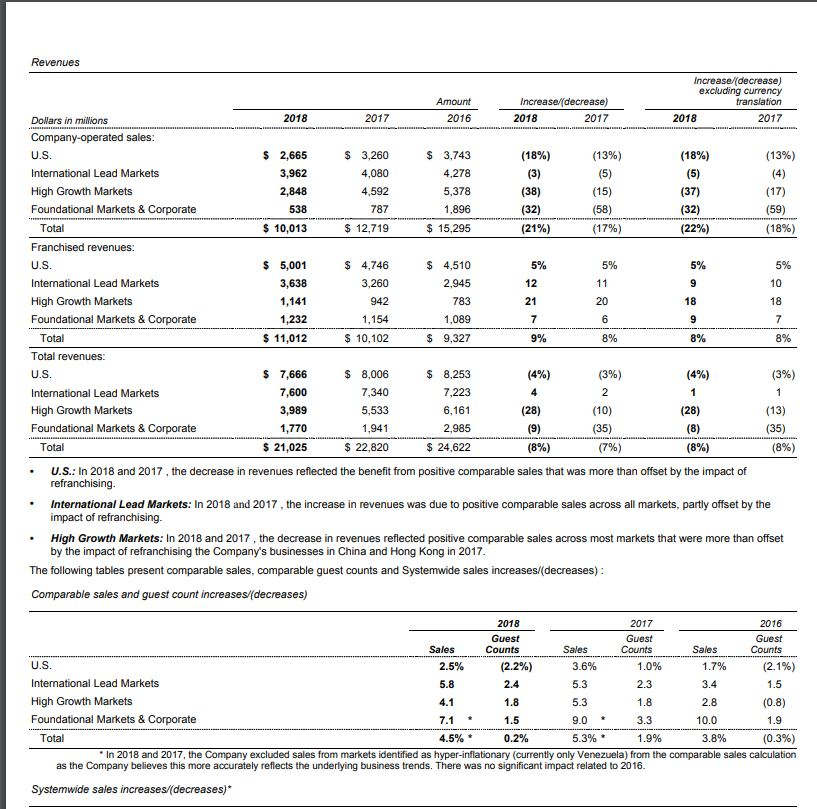
11. Asset Turnover: Sales (Sales by company operated restaurants + revenues from franchised restaurants) / average total assets
2018: $21025.2/$##,### = #.##
2017: $22820.4/$##,### = #.##
12. Return on Total Assets: (Net income + interest expense)/ average total assets
Get into a decimal then percentage then 2 decimal places
2018: $#,###/$##,### = #.##%
2017: $#,###/$##,### = #.##%
13. Return on Stockholders Equity: Net income/ average common stockholders equity
will be a percent -
2018: $5,924.3/$##,### = #.##%
2017: $5,192.3/$##,### = #.##%
14. Return on Common Stockholders Equity: (net income- preferred dividends)/ shares of common stock outstanding
2018: $#,###/$##,### = #.##%
2017: $#,###/$##,### = #.##%
15. Earnings Per Share on Common Stock: (net income- preferred dividends)/ shares of common stock outstanding
2018: $#,###/$##,### = $#.##
2017: $#,###/$##,### = $#.##
16. Price-Earnings Ratio: market price per share of common stock/ earnings per share on common stock
2018: $#,###/$##,### = $#.##
2017: $#,###/$##,### = $#.##
17. Dividends Per Share: dividends on common stock/ shares of common stock outstanding
2018: $#,###/$##,### = $#.##
2017: $#,###/$##,### = $#.##
18. Dividend Yield: dividends per share of common stock/ market price per share of common stock
2018: $#,###/$##,### = #.##%
2017: $#,###/$##,### = #.##%
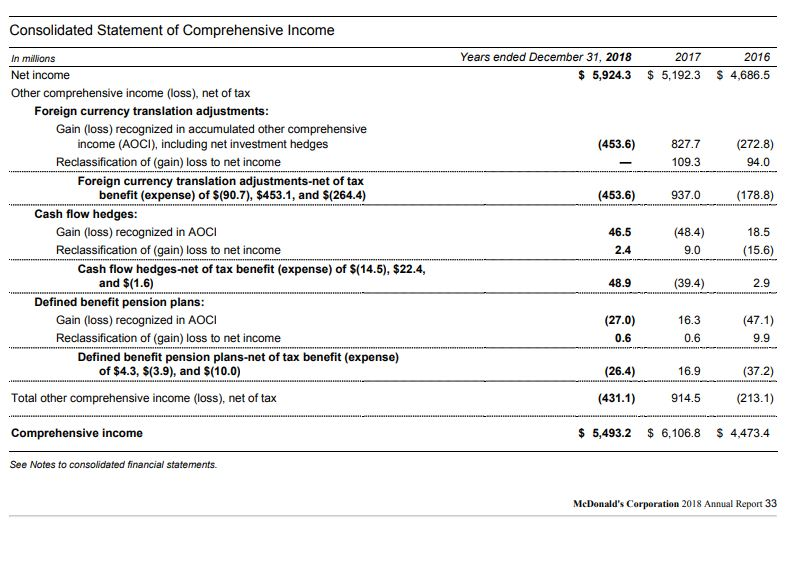
4 Consolidated Operating Results Operating results 2018 2017 2016 Increased Increase/ Dollars and shares in millions, except per share data Amount (decrease) Amount (decrease) Amount Revenues Sales by Company-operated restaurants $ 10,013 (21%) $ 12,719 (17%) $ 15,295 Revenues from franchised restaurants 11,012 9 10.101 8 9,327 Total revenues 21,025 (8) 22.820 (7) 24,622 Operating costs and expenses Company-operated restaurant expenses 8,266 (21) 10,410 (18) 12,699 Franchised restaurants occupancy expenses 1,973 10 1,789 4 1,718 Selling, general & administrative expenses 2,200 (1) 2,231 (6) 2,384 Other operating (income) expense, net (237) 80 (1,163) n/m 76 Total operating costs and expenses 12,202 (8) 13,267 (21) 16,877 Operating income 8,823 (8) 9,553 23 7,745 Interest expense 981 7 922 885 Nonoperating (income) expense, net 26 (56) 58 n/m (6) Income before provision for income taxes 7,816 (9) 8,573 25 6,866 Provision for income taxes 1,892 (44) 3,381 55 2,180 Net Income $ 5,924 14% $ 5,192 11% $ 4,686 Earnings per common share-diluted $ 7.54 18% $ 6.37 17% $ 5.44 Weighted-average common shares outstanding, diluted 786 (4%) 815.5 (5%) 861.2 nm Not meaningfu IMPACT OF FOREIGN CURRENCY TRANSLATION ON REPORTED RESULTS While changes in foreign currency exchange rates affect reported results, McDonald's mitigates exposures, where practical, by purchasing goods and services in local currencies, financing in local currencies and hedging certain foreign-denominated cash flows. In 2018, results reflected a positive foreign currency impact of $0.04, primarily due to the stronger Euro and British Pound. In 2017, results reflected the stronger Euro, offset by the weaker British Pound. In 2016, results were negatively impacted by the weaker British Pound as well as many other currencies. Impact of foreign currency translation on reported results Currency translation Reported amount benefit (cost) In millions, except per share data 2018 2017 2016 2018 2017 2016 Revenues $ 21,025 $ 22,820 $ 24,622 $ 123 $ 186 $ (692) Company-operated margins 1,747 2,309 2,596 4 17 (89) Franchised margins 9,039 8,312 7,609 57 25 (118) Selling general & administrative expenses 2,200 2,231 2,384 (13) (10) 28 Operating income 8,823 9,553 7.745 56 28 (173) Net income 5,924 5,192 4,686 33 2 (97) Earings per common share-diluted 7.54 6.37 5.44 0.04 (0.11) McDonald's Corporation 2018 Annual Report 20 Revenues (38) 12 9 9 Increase/(decrease) excluding currency Amount Increase/(decrease) translation Dollars in millions 2018 2017 2016 2018 2017 2018 2017 Company-operated sales: U.S. $ 2,665 $ 3,260 $ 3,743 (18%) (13%) (18%) (13%) International Lead Markets 3,962 4,080 4,278 (3) (5) (5) (4) High Growth Markets 2,848 4,592 5,378 (15) (37) (17) Foundational Markets & Corporate 538 787 1,896 (32) (58) (32) (59) Total $ 10,013 $ 12,719 $ 15,295 (21%) (17%) (22%) (18%) Franchised revenues: U.S. $ 5,001 $ 4,746 $ 4,510 5% 5% 5% 5% International Lead Markets 3,638 3,260 2,945 11 10 High Growth Markets 1,141 942 783 21 20 18 18 Foundational Markets & Corporate 1,232 1,154 1,089 7 6 7 Total $ 11,012 $ 10,102 $ 9,327 8% 8% 8% Total revenues: U.S. $ 7,666 $ 8,006 $ 8,253 (4%) (3%) (4%) (3%) International Lead Markets 7,600 7,340 7,223 2 1 High Growth Markets 3,989 5,533 6,161 (28) (10) (28) (13) Foundational Markets & Corporate 1,770 1.941 2,985 (9) (35) (8) (35) Total $ 21,025 $ 22,820 $ 24,622 (8%) (7%) (8%) (8%) U.S.: In 2018 and 2017, the decrease in revenues reflected the benefit from positive comparable sales that was more than offset by the impact of refranchising. International Lead Markets: In 2018 and 2017, the increase in revenues was due to positive comparable sales across all markets, partly offset by the impact of refranchising. High Growth Markets: In 2018 and 2017, the decrease in revenues reflected positive comparable sales across most markets that were more than offset by the impact of refranchising the Company's businesses in China and Hong Kong in 2017. The following tables present comparable sales, comparable guest counts and Systemwide sales increases/(decreases): Comparable sales and guest count increases (decreases) 9% 4 1 2018 2017 2016 Guest Guest Guest Sales Counts Sales Counts Sales Counts U.S. 2.5% (2.2%) 3.6% 1.0% 1.7% (2.1%) International Lead Markets 5.8 2.4 5.3 2.3 3.4 1.5 High Growth Markets 4.1 1.8 5.3 1.8 2.8 (0.8) Foundational Markets & Corporate 7.1 1.5 9.0 3.3 10.0 1.9 Total 4.5% 0.2% 5.3% 1.9% 3.8% (0.3%) In 2018 and 2017, the Company excluded sales from markets identified as hyper-inflationary (currently only Venezuela) from the comparable sales calculation as the Company believes this more accurately reflects the underlying business trends. There was no significant impact related to 2016. Systemwide sales increases (decreases)* Consolidated Statement of Income Years ended December 31, 2018 2017 2016 $ $ $ 10,012.7 11,012.5 21,025.2 12,718.9 10,101.5 22,820.4 15,295.0 9,326.9 24,621.9 In millions, except per share data REVENUES Sales by Company-operated restaurants Revenues from franchised restaurants Total revenues OPERATING COSTS AND EXPENSES Company-operated restaurant expenses Food & paper Payroll & employee benefits Occupancy & other operating expenses Franchised restaurants-occupancy expenses Selling, general & administrative expenses Other operating (income) expense, net Total operating costs and expenses Operating income Interest expense-net of capitalized interest of $5.6, $5.3 and $7.1 Nonoperating (income) expense, net Income before provision for income taxes Provision for income taxes Net income Earnings per common share-basic Earnings per common share-diluted Dividends declared per common share Weighted-average shares outstanding-basic Weighted average shares outstanding-diluted See Notes to consolidated financial statements. 3,153.8 2,937.9 2,174.2 1,973.3 2,200.2 (236.8) 12,202.6 8,822.6 981.2 25.3 7,816.1 1,891.8 5,924.3 7.61 7.54 4.19 778.2 785.6 4,033.5 3,528.5 2,847.6 1,790.0 2,231.3 (1,163.2) 13,267.7 9,552.7 921.3 57.9 8,573.5 3,381.2 5,192.3 6.43 6.37 3.83 807.4 815.5 4,896.9 4,134.2 3,667.7 1,718.4 2,384.5 75.7 16,877.4 7,744.5 884.8 (6.3) 6,866.0 2,179.5 4,686.5 5.49 $ $ $ $ $ $ $ $ $ 5.44 $ $ $ 3.61 854.4 861.2 McDonald's Corporation 2018 Annual Report 32 Consolidated Statement of Comprehensive Income Years ended December 31, 2018 $ 5,924.3 2017 $ 5,192.3 2016 $ 4,686.5 (453.6) 827.7 109.3 (272.8) 94.0 (453.6) 937.0 (178.8) In millions Net income Other comprehensive income (loss), net of tax Foreign currency translation adjustments: Gain (loss) recognized in accumulated other comprehensive income (AOCI), including net investment hedges Reclassification of gain) loss to net income Foreign currency translation adjustments-net of tax benefit (expense) of $(90.7), $453.1, and $(264.4) Cash flow hedges: Gain (loss) recognized in AOCI Reclassification of (gain) loss to net income Cash flow hedges-net of tax benefit (expense) of $(14.5), $22.4, and $(1.6) Defined benefit pension plans: Gain (loss) recognized in AOCI Reclassification of (gain) loss to net income Defined benefit pension plans-net of tax benefit (expense) of $4.3, $(3.9), and $(10.0) Total other comprehensive income (loss), net of tax 46.5 (48.4) 9.0 18.5 (15.6) 2.4 48.9 (39.4) 2.9 (27.0) 0.6 16.3 0.6 (47.1) 9.9 (26.4) 16.9 (37.2) (431.1) 914.5 (213.1) Comprehensive income $ 5,493.2 $ 6,106.8 $ 4,473.4 See Notes to consolidated financial statements. McDonald's Corporation 2018 Annual Report 33 Consolidated Balance Sheet December 31, 2018 2017 $ 866.0 2,441.5 51.1 694.6 4,053.2 2,463.8 1,976.2 58.8 828.4 5.327.2 1,202.8 2,331.5 2,381.0 5,915.3 1.085.7 2,379.7 2,562.8 6.028.2 37,193.6 (14,350.9) 22,842.7 $ 32,811.2 36,626.4 (14,178.1) 22,448.3 $ 33,803.7 In millions, except per share data ASSETS Current assets Cash and equivalents Accounts and notes receivable Inventories, at cost, not in excess of market Prepaid expenses and other current assets Total current assets Other assets Investments in and advances to affiliates Goodwill Miscellaneous Total other assets Property and equipment Property and equipment, at cost Accumulated depreciation and amortization Net property and equipment Total assets LIABILITIES AND SHAREHOLDERS' EQUITY Current liabilities Accounts payable Income taxes Other taxes Accrued interest Accrued payroll and other liabilities Total current liabilities Long-term debt Long-term income taxes Deferred revenues - initial franchise fees Other long-term liabilities Deferred income taxes Shareholders' equity (deficit) Preferred stock, no par value; authorized - 165.0 million shares; issued - none Common stock, $.01 par value; authorized - 3.5 billion shares; issued - 1,660.6 million shares Additional paid-in capital Retained earnings Accumulated other comprehensive income Common stock in treasury, at cost; 893.5 and 866.5 million shares Total shareholders' equity (deficit) Total liabilities and shareholders' equity (deficit) See Notes to consolidated financial statements. $ 1,207.9 228.3 253.7 297.0 986.6 2,973.5 31,075.3 2,081.2 627.8 1,096.3 1,215.5 924.8 265.8 275.4 278.4 1,146.2 2,890.6 29,536.4 2,370.9 1,154.4 1.119.4 16.6 7,376.0 50,487.0 (2,609.5) (61,528.5) (6,258.4) 32,811.2 16.6 7,072.4 48,325.8 (2,178.4) (56,504.4) (3.268.0) $ 33,803.7 McDonald's Corporation 2018 Annual Report 34 4 Consolidated Operating Results Operating results 2018 2017 2016 Increased Increase/ Dollars and shares in millions, except per share data Amount (decrease) Amount (decrease) Amount Revenues Sales by Company-operated restaurants $ 10,013 (21%) $ 12,719 (17%) $ 15,295 Revenues from franchised restaurants 11,012 9 10.101 8 9,327 Total revenues 21,025 (8) 22.820 (7) 24,622 Operating costs and expenses Company-operated restaurant expenses 8,266 (21) 10,410 (18) 12,699 Franchised restaurants occupancy expenses 1,973 10 1,789 4 1,718 Selling, general & administrative expenses 2,200 (1) 2,231 (6) 2,384 Other operating (income) expense, net (237) 80 (1,163) n/m 76 Total operating costs and expenses 12,202 (8) 13,267 (21) 16,877 Operating income 8,823 (8) 9,553 23 7,745 Interest expense 981 7 922 885 Nonoperating (income) expense, net 26 (56) 58 n/m (6) Income before provision for income taxes 7,816 (9) 8,573 25 6,866 Provision for income taxes 1,892 (44) 3,381 55 2,180 Net Income $ 5,924 14% $ 5,192 11% $ 4,686 Earnings per common share-diluted $ 7.54 18% $ 6.37 17% $ 5.44 Weighted-average common shares outstanding, diluted 786 (4%) 815.5 (5%) 861.2 nm Not meaningfu IMPACT OF FOREIGN CURRENCY TRANSLATION ON REPORTED RESULTS While changes in foreign currency exchange rates affect reported results, McDonald's mitigates exposures, where practical, by purchasing goods and services in local currencies, financing in local currencies and hedging certain foreign-denominated cash flows. In 2018, results reflected a positive foreign currency impact of $0.04, primarily due to the stronger Euro and British Pound. In 2017, results reflected the stronger Euro, offset by the weaker British Pound. In 2016, results were negatively impacted by the weaker British Pound as well as many other currencies. Impact of foreign currency translation on reported results Currency translation Reported amount benefit (cost) In millions, except per share data 2018 2017 2016 2018 2017 2016 Revenues $ 21,025 $ 22,820 $ 24,622 $ 123 $ 186 $ (692) Company-operated margins 1,747 2,309 2,596 4 17 (89) Franchised margins 9,039 8,312 7,609 57 25 (118) Selling general & administrative expenses 2,200 2,231 2,384 (13) (10) 28 Operating income 8,823 9,553 7.745 56 28 (173) Net income 5,924 5,192 4,686 33 2 (97) Earings per common share-diluted 7.54 6.37 5.44 0.04 (0.11) McDonald's Corporation 2018 Annual Report 20 Revenues (38) 12 9 9 Increase/(decrease) excluding currency Amount Increase/(decrease) translation Dollars in millions 2018 2017 2016 2018 2017 2018 2017 Company-operated sales: U.S. $ 2,665 $ 3,260 $ 3,743 (18%) (13%) (18%) (13%) International Lead Markets 3,962 4,080 4,278 (3) (5) (5) (4) High Growth Markets 2,848 4,592 5,378 (15) (37) (17) Foundational Markets & Corporate 538 787 1,896 (32) (58) (32) (59) Total $ 10,013 $ 12,719 $ 15,295 (21%) (17%) (22%) (18%) Franchised revenues: U.S. $ 5,001 $ 4,746 $ 4,510 5% 5% 5% 5% International Lead Markets 3,638 3,260 2,945 11 10 High Growth Markets 1,141 942 783 21 20 18 18 Foundational Markets & Corporate 1,232 1,154 1,089 7 6 7 Total $ 11,012 $ 10,102 $ 9,327 8% 8% 8% Total revenues: U.S. $ 7,666 $ 8,006 $ 8,253 (4%) (3%) (4%) (3%) International Lead Markets 7,600 7,340 7,223 2 1 High Growth Markets 3,989 5,533 6,161 (28) (10) (28) (13) Foundational Markets & Corporate 1,770 1.941 2,985 (9) (35) (8) (35) Total $ 21,025 $ 22,820 $ 24,622 (8%) (7%) (8%) (8%) U.S.: In 2018 and 2017, the decrease in revenues reflected the benefit from positive comparable sales that was more than offset by the impact of refranchising. International Lead Markets: In 2018 and 2017, the increase in revenues was due to positive comparable sales across all markets, partly offset by the impact of refranchising. High Growth Markets: In 2018 and 2017, the decrease in revenues reflected positive comparable sales across most markets that were more than offset by the impact of refranchising the Company's businesses in China and Hong Kong in 2017. The following tables present comparable sales, comparable guest counts and Systemwide sales increases/(decreases): Comparable sales and guest count increases (decreases) 9% 4 1 2018 2017 2016 Guest Guest Guest Sales Counts Sales Counts Sales Counts U.S. 2.5% (2.2%) 3.6% 1.0% 1.7% (2.1%) International Lead Markets 5.8 2.4 5.3 2.3 3.4 1.5 High Growth Markets 4.1 1.8 5.3 1.8 2.8 (0.8) Foundational Markets & Corporate 7.1 1.5 9.0 3.3 10.0 1.9 Total 4.5% 0.2% 5.3% 1.9% 3.8% (0.3%) In 2018 and 2017, the Company excluded sales from markets identified as hyper-inflationary (currently only Venezuela) from the comparable sales calculation as the Company believes this more accurately reflects the underlying business trends. There was no significant impact related to 2016. Systemwide sales increases (decreases)* Consolidated Statement of Income Years ended December 31, 2018 2017 2016 $ $ $ 10,012.7 11,012.5 21,025.2 12,718.9 10,101.5 22,820.4 15,295.0 9,326.9 24,621.9 In millions, except per share data REVENUES Sales by Company-operated restaurants Revenues from franchised restaurants Total revenues OPERATING COSTS AND EXPENSES Company-operated restaurant expenses Food & paper Payroll & employee benefits Occupancy & other operating expenses Franchised restaurants-occupancy expenses Selling, general & administrative expenses Other operating (income) expense, net Total operating costs and expenses Operating income Interest expense-net of capitalized interest of $5.6, $5.3 and $7.1 Nonoperating (income) expense, net Income before provision for income taxes Provision for income taxes Net income Earnings per common share-basic Earnings per common share-diluted Dividends declared per common share Weighted-average shares outstanding-basic Weighted average shares outstanding-diluted See Notes to consolidated financial statements. 3,153.8 2,937.9 2,174.2 1,973.3 2,200.2 (236.8) 12,202.6 8,822.6 981.2 25.3 7,816.1 1,891.8 5,924.3 7.61 7.54 4.19 778.2 785.6 4,033.5 3,528.5 2,847.6 1,790.0 2,231.3 (1,163.2) 13,267.7 9,552.7 921.3 57.9 8,573.5 3,381.2 5,192.3 6.43 6.37 3.83 807.4 815.5 4,896.9 4,134.2 3,667.7 1,718.4 2,384.5 75.7 16,877.4 7,744.5 884.8 (6.3) 6,866.0 2,179.5 4,686.5 5.49 $ $ $ $ $ $ $ $ $ 5.44 $ $ $ 3.61 854.4 861.2 McDonald's Corporation 2018 Annual Report 32 Consolidated Statement of Comprehensive Income Years ended December 31, 2018 $ 5,924.3 2017 $ 5,192.3 2016 $ 4,686.5 (453.6) 827.7 109.3 (272.8) 94.0 (453.6) 937.0 (178.8) In millions Net income Other comprehensive income (loss), net of tax Foreign currency translation adjustments: Gain (loss) recognized in accumulated other comprehensive income (AOCI), including net investment hedges Reclassification of gain) loss to net income Foreign currency translation adjustments-net of tax benefit (expense) of $(90.7), $453.1, and $(264.4) Cash flow hedges: Gain (loss) recognized in AOCI Reclassification of (gain) loss to net income Cash flow hedges-net of tax benefit (expense) of $(14.5), $22.4, and $(1.6) Defined benefit pension plans: Gain (loss) recognized in AOCI Reclassification of (gain) loss to net income Defined benefit pension plans-net of tax benefit (expense) of $4.3, $(3.9), and $(10.0) Total other comprehensive income (loss), net of tax 46.5 (48.4) 9.0 18.5 (15.6) 2.4 48.9 (39.4) 2.9 (27.0) 0.6 16.3 0.6 (47.1) 9.9 (26.4) 16.9 (37.2) (431.1) 914.5 (213.1) Comprehensive income $ 5,493.2 $ 6,106.8 $ 4,473.4 See Notes to consolidated financial statements. McDonald's Corporation 2018 Annual Report 33 Consolidated Balance Sheet December 31, 2018 2017 $ 866.0 2,441.5 51.1 694.6 4,053.2 2,463.8 1,976.2 58.8 828.4 5.327.2 1,202.8 2,331.5 2,381.0 5,915.3 1.085.7 2,379.7 2,562.8 6.028.2 37,193.6 (14,350.9) 22,842.7 $ 32,811.2 36,626.4 (14,178.1) 22,448.3 $ 33,803.7 In millions, except per share data ASSETS Current assets Cash and equivalents Accounts and notes receivable Inventories, at cost, not in excess of market Prepaid expenses and other current assets Total current assets Other assets Investments in and advances to affiliates Goodwill Miscellaneous Total other assets Property and equipment Property and equipment, at cost Accumulated depreciation and amortization Net property and equipment Total assets LIABILITIES AND SHAREHOLDERS' EQUITY Current liabilities Accounts payable Income taxes Other taxes Accrued interest Accrued payroll and other liabilities Total current liabilities Long-term debt Long-term income taxes Deferred revenues - initial franchise fees Other long-term liabilities Deferred income taxes Shareholders' equity (deficit) Preferred stock, no par value; authorized - 165.0 million shares; issued - none Common stock, $.01 par value; authorized - 3.5 billion shares; issued - 1,660.6 million shares Additional paid-in capital Retained earnings Accumulated other comprehensive income Common stock in treasury, at cost; 893.5 and 866.5 million shares Total shareholders' equity (deficit) Total liabilities and shareholders' equity (deficit) See Notes to consolidated financial statements. $ 1,207.9 228.3 253.7 297.0 986.6 2,973.5 31,075.3 2,081.2 627.8 1,096.3 1,215.5 924.8 265.8 275.4 278.4 1,146.2 2,890.6 29,536.4 2,370.9 1,154.4 1.119.4 16.6 7,376.0 50,487.0 (2,609.5) (61,528.5) (6,258.4) 32,811.2 16.6 7,072.4 48,325.8 (2,178.4) (56,504.4) (3.268.0) $ 33,803.7 McDonald's Corporation 2018 Annual Report 34Step by Step Solution
There are 3 Steps involved in it
Step: 1

Get Instant Access to Expert-Tailored Solutions
See step-by-step solutions with expert insights and AI powered tools for academic success
Step: 2

Step: 3

Ace Your Homework with AI
Get the answers you need in no time with our AI-driven, step-by-step assistance
Get Started


