Need help with these problems. 1. Based on sales over a six-month period, the five top-selling compact cars are Chevy Cruze, Ford Focus, Hyundai Elantra,
Need help with these problems.
1.
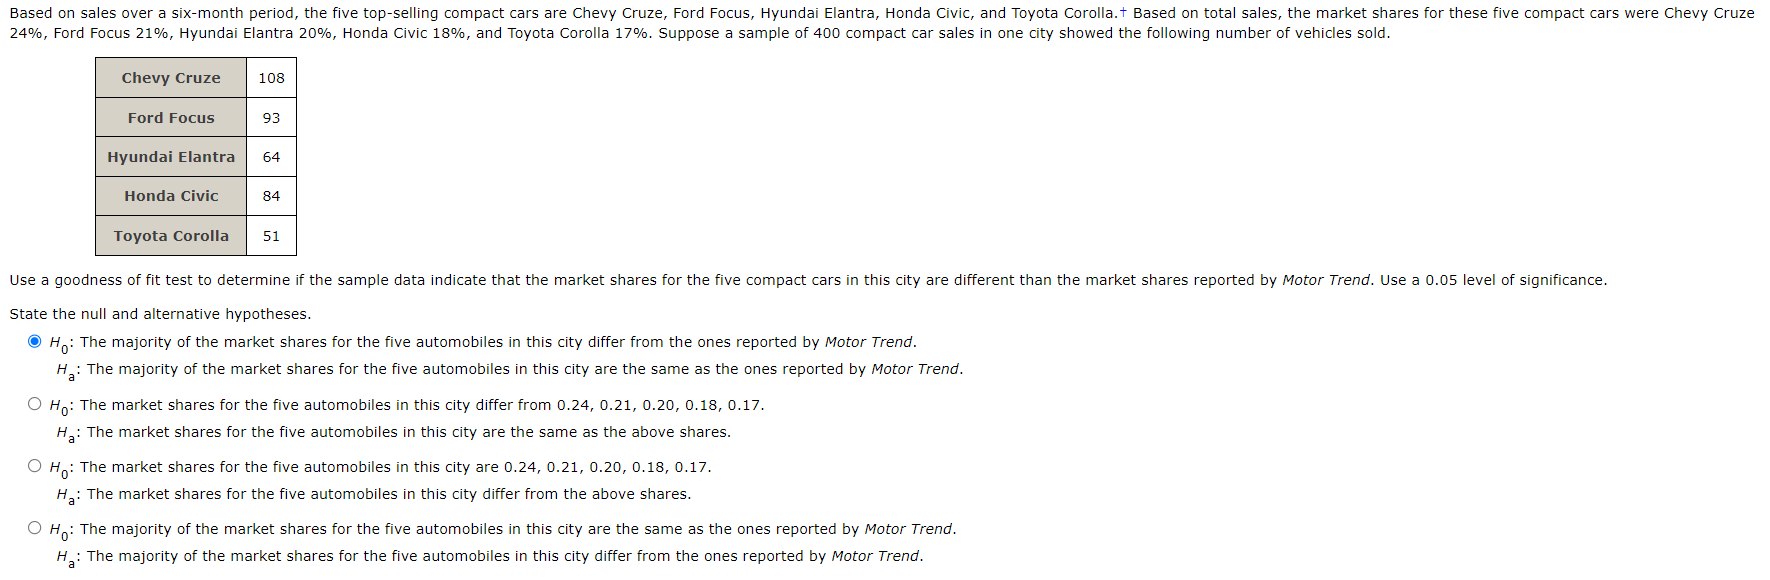
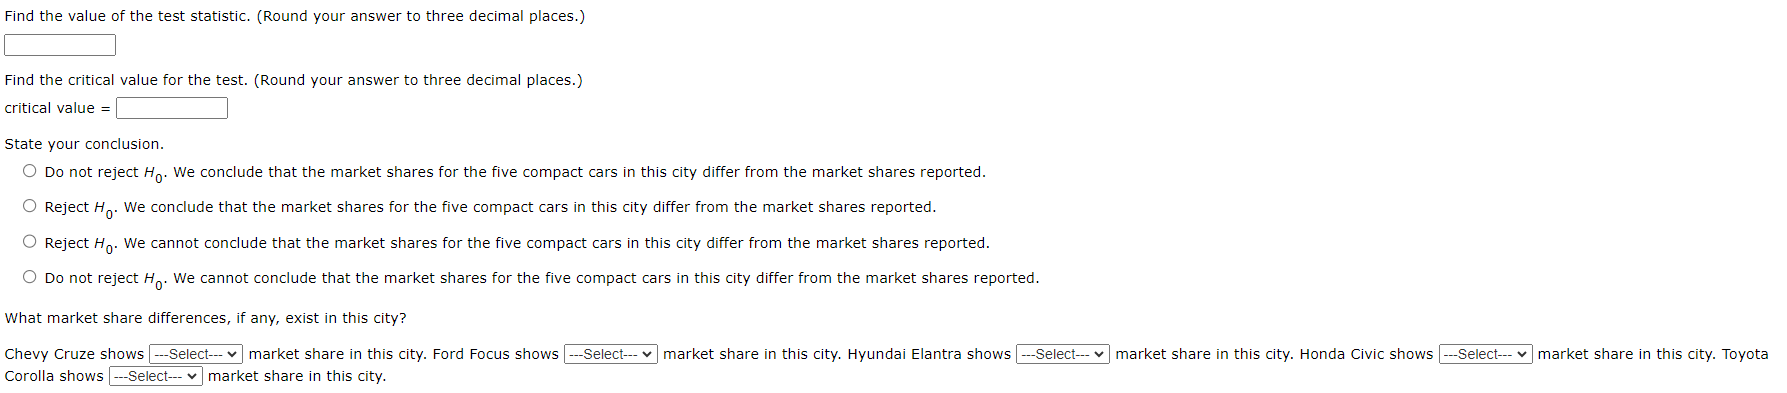
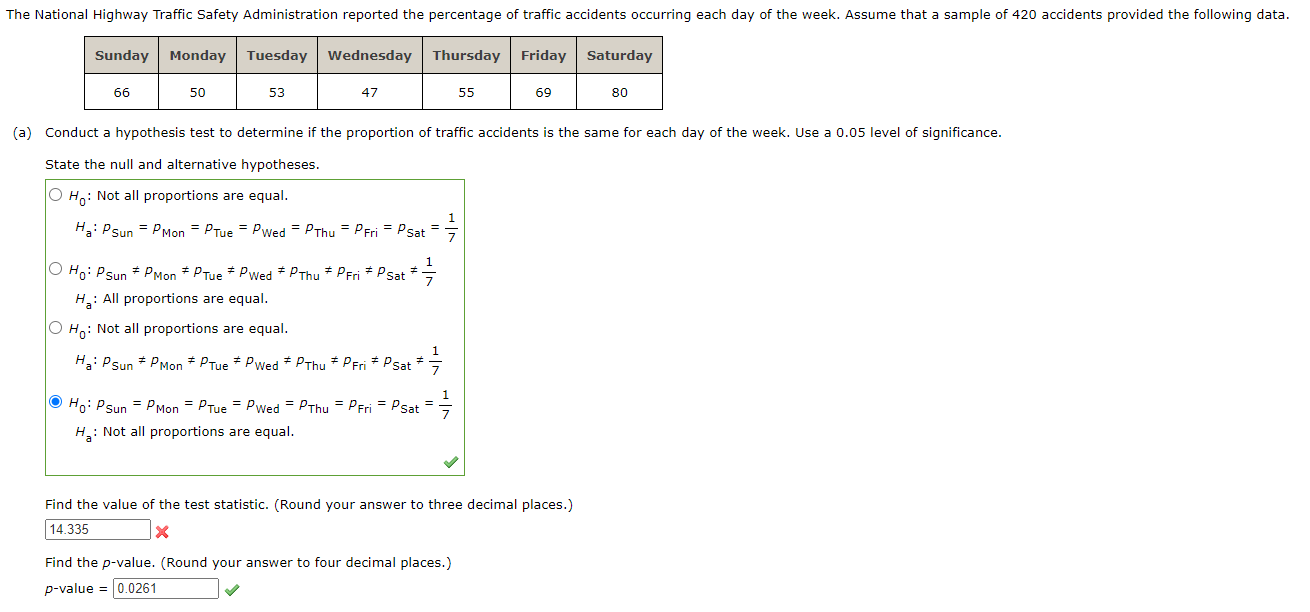
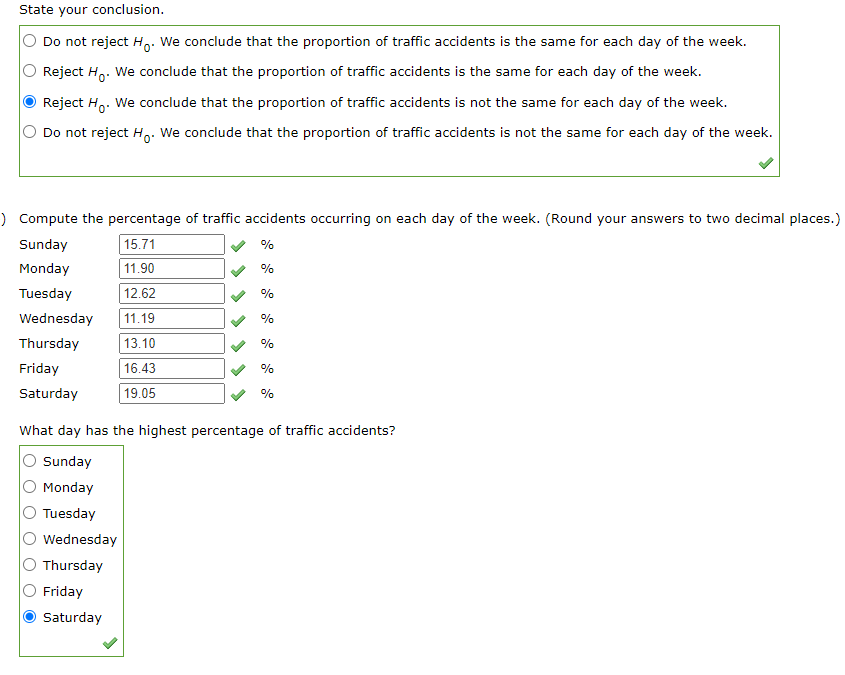
Based on sales over a six-month period, the five top-selling compact cars are Chevy Cruze, Ford Focus, Hyundai Elantra, Honda Civic, and Toyota Corolla.+ Based on total sales, the market shares for these five compact cars were Chevy Cruze 24%, Ford Focus 21%, Hyundai Elantra 20%, Honda Civic 18%, and Toyota Corolla 17%. Suppose a sample of 400 compact car sales in one city showed the following number of vehicles sold. Chevy Cruze 108 Ford Focus 93 Hyundai Elantra 64 Honda Civic 84 Toyota Corolla 51 Use a goodness of fit test to determine if the sample data indicate that the market shares for the five compact cars in this city are different than the market shares reported by Motor Trend. Use a 0.05 level of significance. State the null and alternative hypotheses. O Ho: The majority of the market shares for the five automobiles in this city differ from the ones reported by Motor Trend. Ha: The majority of the market shares for the five automobiles in this city are the same as the ones reported by Motor Trend. O Ho: The market shares for the five automobiles in this city differ from 0.24, 0.21, 0.20, 0.18, 0.17. Ha: The market shares for the five automobiles in this city are the same as the above shares. O Ho: The market shares for the five automobiles in this city are 0.24, 0.21, 0.20, 0.18, 0.17. Ha: The market shares for the five automobiles in this city differ from the above shares. O Ho: The majority of the market shares for the five automobiles in this city are the same as the ones reported by Motor Trend. He: The majority of the market shares for the five automobiles in this city differ from the ones reported by Motor Trend.Find the value of the test statistic. (Round your answer to three decimal places.) 1 Find the critical value for the test. (Round your answer to three decimal places.) critical value = : State your conclusion. O Do not reject Hy. We conclude that the market shares for the five compact cars in this city differ from the market shares reported. ) Reject Hy. We conclude that the market shares for the five compact cars in this city differ from the market shares reported. O Reject H. We cannot conclude that the market shares for the five compact cars in this city differ from the market shares reported. O Do not reject Hg. We cannot conclude that the market shares for the five compact cars in this city differ from the market shares reported. What market share differences, if any, exist in this city? Chevy Cruze shows market share in this city. Ford Focus shows market share in this city. Hyundai Elantra shows market share in this city. Honda Civic shows market share in this city. Toyota Corolla shows market share in this city. The National Highway Traffic Safety Administration reported the percentage of traffic accidents occurring each day of the week. Assume that a sample of 420 accidents provided the following data. Sunday Monday Tuesday Wednesday Thursday Friday Saturday 66 50 53 47 55 69 80 (a) Conduct a hypothesis test to determine if the proportion of traffic accidents is the same for each day of the week. Use a 0.05 level of significance. State the null and alternative hypotheses. O Ho: Not all proportions are equal. Hai Psun = PMon = PTue = Pwed = PThu = PFri = Psat = O Ho: Psun # PMon * PTue * Pwed * PThu * PFri * Psat # He: All proportions are equal. O Ho: Not all proportions are equal. Ha: Psun * PMon * PTue * Pwed # PThu * PFri # Psat O Ho: Psun = PMon = PTue = Pwed = PThu = PFri = PSat = Ha: Not all proportions are equal. Find the value of the test statistic. (Round your answer to three decimal places.) 14.335 X Find the p-value. (Round your answer to four decimal places.) p-value = 0.0261State your conclusion. ) Do not reject H. We conclude that the proportion of traffic accidents is the same for each day of the week. ) Reject H. We conclude that the proportion of traffic accidents is the same for each day of the week. Reject H,. We conclude that the proportion of traffic accidents is not the same for each day of the week. ) Do not reject H. We conclude that the proportion of traffic accidents is not the same for each day of the week. L Compute the percentage of traffic accidents occurring on each day of the wesek. {Round your answers to two decimal places.) Sunday o % Monday o 9 Tuesday o o Wednesday o 9 Thursday o Y Friday o 9h Saturday o 9 What day has the highest percentage of traffic accidents? ) Tuesday ) Wednesday ) Thursday ) Friday Ssaturday L
Step by Step Solution
There are 3 Steps involved in it
Step: 1
Get Instant Access to Expert-Tailored Solutions
See step-by-step solutions with expert insights and AI powered tools for academic success
Step: 2
Step: 3
Ace Your Homework with AI
Get the answers you need in no time with our AI-driven, step-by-step assistance