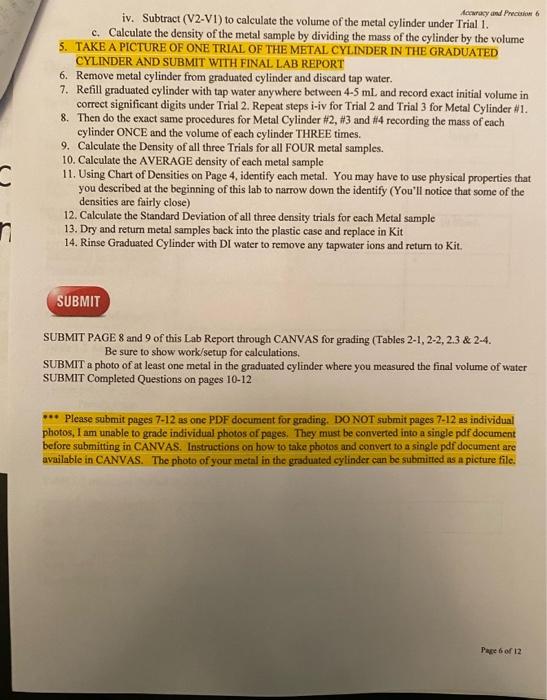
Density of Metals NAMEt Table 2-1 Describe color, texture of metal samplo Is the metal anracted to magnet? Acanay av Pncinin os Table 2-2 Describe color, texture of metal sample Is the metal attracted to magnet? 5. Dispense alcohol from beaker bock into original container (there is nothing wnong with it as long as your beaker was clean and dry to begin with. If shouldn't be contaminated) 6. Using a paper towel, completely dry the beaker. (Make sure there is no residual alcobot in the beaker) 7. Weigh the empty beaker (it should weigh the same as your fist trial if you dried it completely) 8. REPEAT steps 2-6 two more times with 10.00mL samples of isopropyl aleobol. Calculate the density of each trial on Data table 1-1 9. Dispense last trial of isopropyl aloohol back into eriginal container. Close container tightly. You will use this isopropyl alcohol in Lab *5 10. Rinse beaker with Distilled water. Dry and retum to kit. Remove pipet purnp from 5.00mL pipet. Return pump to kit. 11. Using a disposable pipet (You have a Ziploc bag of disposable pipets in your kit) to dispense distilled water through the 5.00mL pipet to rinse out any residul isopropyl alcohol. - Table 1-2 Calculate the percent error of your average density deteraiaed in the lab **Table 1-3 Calculate the standard deviation of the three Calculated (Experimental) densities of alcohol. (Methods to calculate standard deviation given in Lab 4 pewerpoint) SUBMIT PAGE 7 of this Lab Report through CANVAS for gading (Tables 1-1, 1-2 \& 1Be sure to show work/setup for calculations. Density of Metals - 4 cylinders of various metals Procedure: (Refenence Powerpoint on Cannss for pichures of detailend opplanation of frecofura) 1. Obtain container with 4 cylinders of metal from kit 2. You'll notice that one cylinder is obviously differeat from the other three... bet thee of the cylinders are very similar in color. Assign each cylinder a number 1,2,3 or 4 which will correlate with the four data tables on page 8-9 of lab report. On Tables 21 through 24, describe the color and texture of each cylinder. There are slight differenoes in color even between the throe that are similar. Be detailed as possible in your description 3. Obtain a magnet (any refrigerator magnet will work). Is the magnet attracted to the metal? Record observation for each metal on Tables 2-1 through 2-4. 4. Choose one metal cylinder to start wich and follow steps below: a. Plaee metal cylinder on scale and record mass under Trial 1 b. Obtain 10mL graduated cylinder from kit i. Add approximately 4.5 ml of tap water to graduated cylinder. Record exact initial volume in correct significant digiss under Trial 1 ii. Carefilly add metal cylinder Hi so the graduated cylinder. (Allow it to slowly slide into graduited cylinder so as so not splash any water out) (See Powepoint for video) iii. Record exact Final Volume of water level in correct sypififast digits under Trial 1 iv. Subtract (V2-V1) to calculate the volume of the metal cylinder under Trial 1. c. Calculate the density of the metal sample by dividing the mass of the cylinder by the volume 5. TAKE A PICTURE OF ONE TRIAL OF THE METAL CYLINDER IN THE GRADUATED CYLINDER AND SUBMIT WITH FINAL LAB REPORT 6. Remove metal cylinder from graduated cylinder and discard tap water. 7. Refill graduated cylinder with tap water anywhere between 4-5 mL and record exact initial volume in correct significant digits under Trial 2. Repent steps i-iv for Trial 2 and Trial 3 for Metal Cylinder #1. 8. Then do the exact same procedures for Metal Cylinder #2,#3 and #4 recording the mass of each cylinder ONCE and the volume of each cylinder THREE times. 9. Calculate the Density of all three Trials for all FOUR metal samples. 10. Calculate the AVERAGE density of each metal sample 11. Using Chart of Densities on Page 4, identify each metal. You may have to use physical properties that you described at the beginning of this lab to narrow down the identify (You'll notice that some of the densities are fairly close) 12. Calculate the Standard Deviation of all three density trials for cach Metal sample 13. Dry and retum metal samples back into the plastic case and replace in Kit 14. Rinse Graduated Cylinder with DI water to remove any tapwater ions and return to Kit. SUBMIT SUBMIT PAGE 8 and 9 of this Lab Report through CANVAS for grading (Tables 2-1, 2-2, 2.3 \& 2-4. Be sure to show work/setup for calculations. SUBMIT a photo of at least one metal in the graduated cylinder where you measured the final volume of water SUBMIT Completed Questions on pages 10-12 Please submit pages 7-12 as one PDF document for grading. DO NOT submit pages 712 as individual photos, 1 am unable to grade individual photos of pages. They must be converted into a single pdf document before sabmitting in CANVAS. Instructions on how to take pbotos and convert to a single pdi document are available in CANVAS. The photo of your metal in the graduited cylinder can be submitted as a picture file