

Answered step by step
Verified Expert Solution
Question
1 Approved Answer
need MATLAB code and answers of each question separately, please do it asap 3 - The frequency domain representation of a square wave So far
need MATLAB code and answers of each question separately, please do it asap
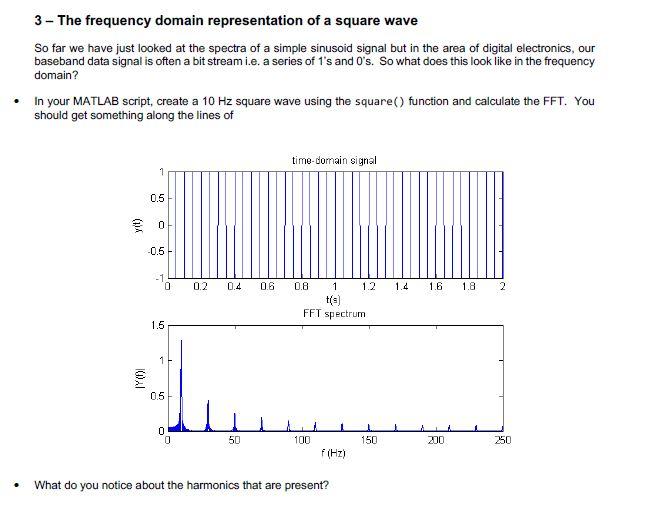
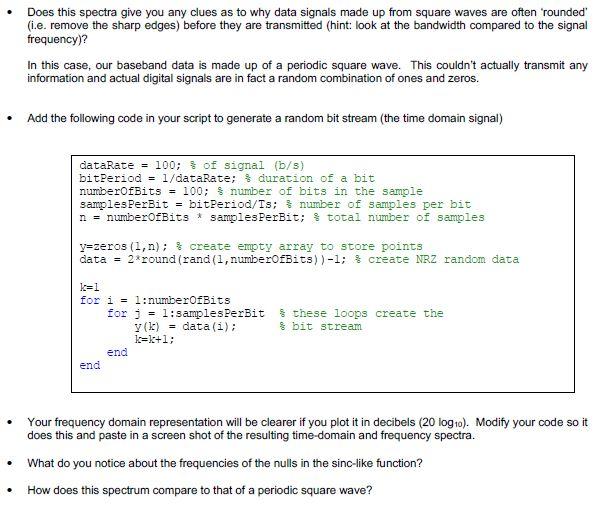
3 - The frequency domain representation of a square wave So far we have just looked at the spectra of a simple sinusoid signal but in the area of digital electronics, our baseband data signal is often a bit stream i.e. a series of 1's and O's. So what does this look like in the frequency domain? In your MATLAB script, create a 10 Hz square wave using the square() function and calculate the FFT. You should get something along the lines of time-domain signal 1 0.5 -0.5 0 0.2 0.4 0.6 08 1.4 1.6 1.8 2 1 1.2 t(s) FFT spectrum 1.5 1 0.5 0 50 100 150 200 250 f(Hz) What do you notice about the harmonics that are present? Does this spectra give you any clues as to why data signals made up from square waves are often 'rounded (i.e. remove the sharp edges) before they are transmitted (hint: look at the bandwidth compared to the signal frequency)? In this case, our baseband data is made up of a periodic square wave. This couldn't actually transmit any information and actual digital signals are in fact a random combination of ones and zeros. Add the following code in your script to generate a random bit stream (the time domain signal) dataRate = 100; of signal (b/s) bitPeriod = 1/dataRate; $ duration of a bit numberOfBits = 100; $number of bits in the sample samples Perbit = bitPeriod/Ts; number of samples per bit n = numberOfBits * samples Perbit; & total number of samples y=zeros (1, n) ; & create empty array to store points data = 2 round (rand(1, numberOfBits))-1; create NRZ random data k=1 for i = 1:numberOfBits for j = 1: samples Perbit these loops create the y (k) = data(i); bit stream k=k+1; end end Your frequency domain representation will be clearer if you plot it in decibels (20 log10). Modify your code so it does this and paste in a screen shot of the resulting time-domain and frequency spectra. What do you notice about the frequencies of the nulls in the sinc-like function? How does this spectrum compare to that of a periodic square wave? 3 - The frequency domain representation of a square wave So far we have just looked at the spectra of a simple sinusoid signal but in the area of digital electronics, our baseband data signal is often a bit stream i.e. a series of 1's and O's. So what does this look like in the frequency domain? In your MATLAB script, create a 10 Hz square wave using the square() function and calculate the FFT. You should get something along the lines of time-domain signal 1 0.5 -0.5 0 0.2 0.4 0.6 08 1.4 1.6 1.8 2 1 1.2 t(s) FFT spectrum 1.5 1 0.5 0 50 100 150 200 250 f(Hz) What do you notice about the harmonics that are present? Does this spectra give you any clues as to why data signals made up from square waves are often 'rounded (i.e. remove the sharp edges) before they are transmitted (hint: look at the bandwidth compared to the signal frequency)? In this case, our baseband data is made up of a periodic square wave. This couldn't actually transmit any information and actual digital signals are in fact a random combination of ones and zeros. Add the following code in your script to generate a random bit stream (the time domain signal) dataRate = 100; of signal (b/s) bitPeriod = 1/dataRate; $ duration of a bit numberOfBits = 100; $number of bits in the sample samples Perbit = bitPeriod/Ts; number of samples per bit n = numberOfBits * samples Perbit; & total number of samples y=zeros (1, n) ; & create empty array to store points data = 2 round (rand(1, numberOfBits))-1; create NRZ random data k=1 for i = 1:numberOfBits for j = 1: samples Perbit these loops create the y (k) = data(i); bit stream k=k+1; end end Your frequency domain representation will be clearer if you plot it in decibels (20 log10). Modify your code so it does this and paste in a screen shot of the resulting time-domain and frequency spectra. What do you notice about the frequencies of the nulls in the sinc-like function? How does this spectrum compare to that of a periodic square waveStep by Step Solution
There are 3 Steps involved in it
Step: 1

Get Instant Access to Expert-Tailored Solutions
See step-by-step solutions with expert insights and AI powered tools for academic success
Step: 2

Step: 3
Ace Your Homework with AI
Get the answers you need in no time with our AI-driven, step-by-step assistance
Get Started
Fundamentals Of Database Systems
Authors: Ramez Elmasri, Shamkant B. Navathe
7th Edition Global Edition
1292097612, 978-1292097619