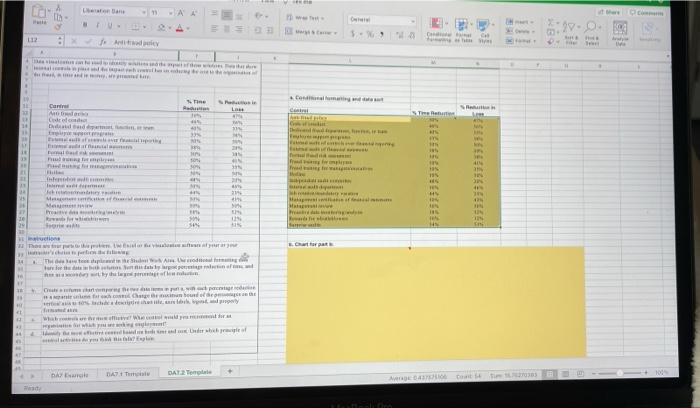
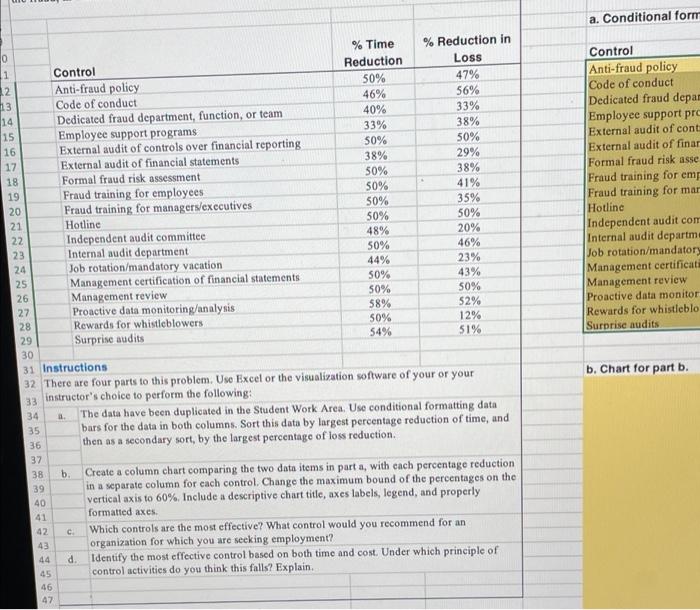
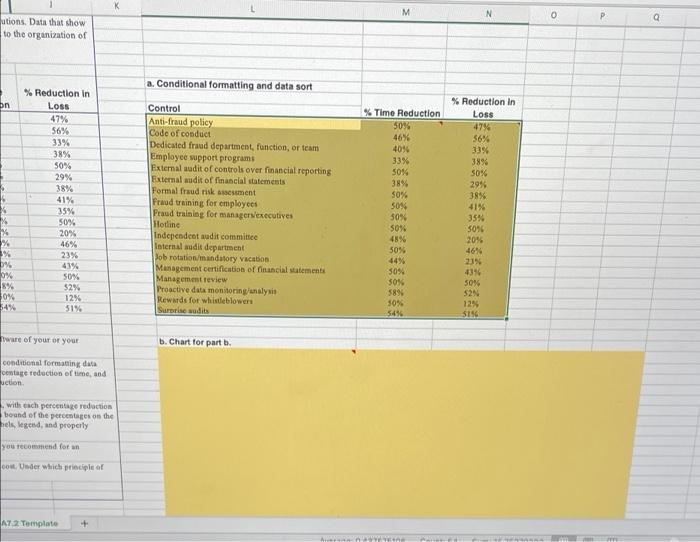
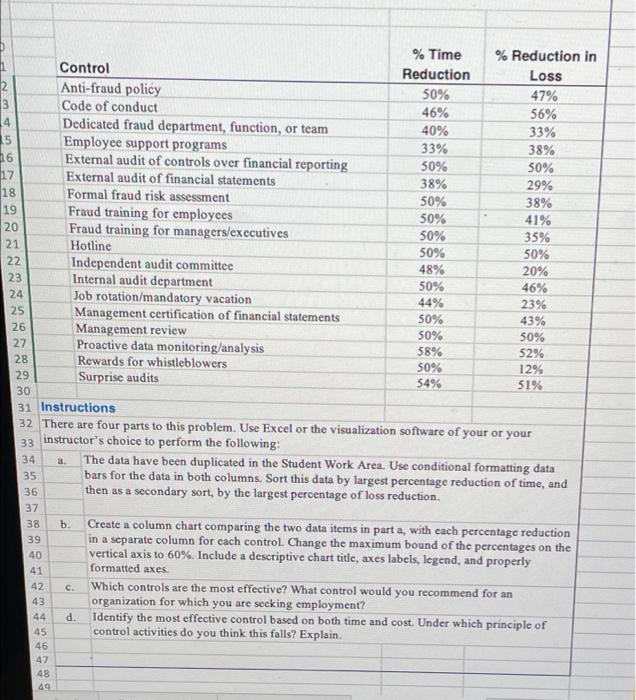
Lane 13 WA TV 5200 C 112 - www . nie Com Care La ST 10 Codec D il pe ori NIP NE HIP 111 ME MC 41 1 SH Me Men Help we www fo 29 SU HS ni Chat nara 14 teple od for the 11 18 harbiy Wave Die DAY 1 DATT D + 10 DE a. Conditional form lo Control Anti-fraud policy Code of conduct Dedicated fraud depan Employee support pre External audit of cont External audit of finar Formal fraud risk asse Fraud training for emp Fraud training for mar Hotline Independent audit com Internal audit departm Job rotation/mandatory Management certificat Management review Proactive data monitor Rewards for whistleblo Surprise audits NNN % Time % Reduction in Loss 1 Reduction Control 47% 12 50% Anti-fraud policy 46% Code of conduct 56% 13 14 Dedicated fraud department, function, or team 40% 33% 15 Employee support programs 33% 38% 16 External audit of controls over financial reporting 50% 50% 17 External audit of financial statements 38% 29% 18 Formal fraud risk assessment 50% 38% 19 Fraud training for employees 50% 41% 20 Fraud training for managers/executives 50% 35% Hotline 50% 50% 22 Independent audit committee 48% 20% 23 Internal audit department 50% 46% 24 Job rotation/mandatory vacation 44% 23% 25 Management certification of financial statements 50% 43% 26 Management review 50% 50% 27 Proactive data monitoring/analysis 58% 52% 28 Rewards for whistleblowers 50% 12% 29 Surprise audits 54% 51% 30 31 Instructions 32 There are four parts to this problem. Uso Excel or the visualization software of your or your 33 instructor's choice to perform the following: 34 The data have been duplicated in the Student Work Area. Use conditional formatting data 35 bars for the data in both columns Sort this data by largest percentage reduction of time, and 36 then as a secondary sort, by the largest percentage of loss reduction. 37 b. Create a column chart comparing the two data items in part a, with cach percentage reduction 39 in a separate column for each control. Change the maximum bound of the percentages on the vertical axis to 60%. Include a descriptive chart title, axes labels, legend, and properly formatted axes Which controls are the most effective? What control would you recommend for an organization for which you are seeking employment? d. Identify the most effective control based on both time and cost. Under which principle of 45 control activities do you think this falls? Explain 46 47 NNNNN b. Chart for part b. 38 40 41 42 C 43 44 M N O P G utions. Data that show to the organization of a. Conditional formatting and data sort on % Reduction in Loss 47% 56% 33% 38% 50% 29% 38% 41% 35% 50% 20% 46% 23% 43% 50% 52% Control Anti-fraud policy Code of conduct Dedicated fred department, function, or team Employee support programs External audit of control over financial reporting External audit of financial statements Formal fraud risk assessment Fraud training for employees Praud training for managers executives Hotline Independent audit committee Internal audit department Pob rotation/mandatory vacation Management certification of financial statements Management review Proactive data monitoring analysis Rewards for whistleblowers Surorise sudits % Time Reduction 50% 46% 40% 33% 5044 38% 50% 50% 50% 50% 48% 50% 44% 30% % Reduction in Loss 47% 56% 33% 389 50% 295 38% 41% 35% 5096 20% 46% 23% 4396 50% 52N 12% 5156 % 0% 0% 8% 0% 54% SON 12% 589 50% 51% ware of your or your b. Chart for parti conditional formating data centage reduction of time, and uction with each percentage reduction bound of the percentages on the hels, ged, and properly You recommend for an Co Under which priciple of AZ 2 Template + 38% NNNN % Time % Reduction in 1 Control Reduction Loss 2 Anti-fraud policy 50% 47% 3 Code of conduct 46% 56% 14 Dedicated fraud department, function, or team 40% 33% .5 Employee support programs 33% 38% 16 External audit of controls over financial reporting 50% 50% 117 External audit of financial statements 29% 18 Formal fraud risk assessment 50% 38% 19 Fraud training for employees 50% 41% 20 Fraud training for managers/executives 50% 35% 21 Hotline 50% 50% 22 Independent audit committee 48% 20% 23 Internal audit department 50% 46% 24 Job rotation/mandatory vacation 44% 23% 25 Management certification of financial statements 50% 43% 26 Management review 50% 50% 27 Proactive data monitoring/analysis 58% 52% 28 Rewards for whistleblowers 50% 12% 29 Surprise audits 54% 51% 30 31 Instructions 32 There are four parts to this problem. Use Excel or the visualization software of your or your 33 instructor's choice to perform the following: 34 The data have been duplicated in the Student Work Area. Use conditional formatting data 35 bars for the data in both columns Sort this data by largest percentage reduction of time, and 36 then as a secondary sort, by the largest percentage of loss reduction. 37 b. Create a column chart comparing the two data items in part a, with each percentage reduction in a separate column for each control. Change the maximum bound of the percentages on the 40 vertical axis to 60%. Include a descriptive chart title, axes labels, legend, and properly formatted axes. Which controls are the most effective? What control would you recommend for an organization for which you are seeking employment? Identify the most effective control based on both time and cost. Under which principle of 45 control activities do you think this falls? Explain. a. 38 39 41 42 43 C. WN d. 46 47 48 49 Lane 13 WA TV 5200 C 112 - www . nie Com Care La ST 10 Codec D il pe ori NIP NE HIP 111 ME MC 41 1 SH Me Men Help we www fo 29 SU HS ni Chat nara 14 teple od for the 11 18 harbiy Wave Die DAY 1 DATT D + 10 DE a. Conditional form lo Control Anti-fraud policy Code of conduct Dedicated fraud depan Employee support pre External audit of cont External audit of finar Formal fraud risk asse Fraud training for emp Fraud training for mar Hotline Independent audit com Internal audit departm Job rotation/mandatory Management certificat Management review Proactive data monitor Rewards for whistleblo Surprise audits NNN % Time % Reduction in Loss 1 Reduction Control 47% 12 50% Anti-fraud policy 46% Code of conduct 56% 13 14 Dedicated fraud department, function, or team 40% 33% 15 Employee support programs 33% 38% 16 External audit of controls over financial reporting 50% 50% 17 External audit of financial statements 38% 29% 18 Formal fraud risk assessment 50% 38% 19 Fraud training for employees 50% 41% 20 Fraud training for managers/executives 50% 35% Hotline 50% 50% 22 Independent audit committee 48% 20% 23 Internal audit department 50% 46% 24 Job rotation/mandatory vacation 44% 23% 25 Management certification of financial statements 50% 43% 26 Management review 50% 50% 27 Proactive data monitoring/analysis 58% 52% 28 Rewards for whistleblowers 50% 12% 29 Surprise audits 54% 51% 30 31 Instructions 32 There are four parts to this problem. Uso Excel or the visualization software of your or your 33 instructor's choice to perform the following: 34 The data have been duplicated in the Student Work Area. Use conditional formatting data 35 bars for the data in both columns Sort this data by largest percentage reduction of time, and 36 then as a secondary sort, by the largest percentage of loss reduction. 37 b. Create a column chart comparing the two data items in part a, with cach percentage reduction 39 in a separate column for each control. Change the maximum bound of the percentages on the vertical axis to 60%. Include a descriptive chart title, axes labels, legend, and properly formatted axes Which controls are the most effective? What control would you recommend for an organization for which you are seeking employment? d. Identify the most effective control based on both time and cost. Under which principle of 45 control activities do you think this falls? Explain 46 47 NNNNN b. Chart for part b. 38 40 41 42 C 43 44 M N O P G utions. Data that show to the organization of a. Conditional formatting and data sort on % Reduction in Loss 47% 56% 33% 38% 50% 29% 38% 41% 35% 50% 20% 46% 23% 43% 50% 52% Control Anti-fraud policy Code of conduct Dedicated fred department, function, or team Employee support programs External audit of control over financial reporting External audit of financial statements Formal fraud risk assessment Fraud training for employees Praud training for managers executives Hotline Independent audit committee Internal audit department Pob rotation/mandatory vacation Management certification of financial statements Management review Proactive data monitoring analysis Rewards for whistleblowers Surorise sudits % Time Reduction 50% 46% 40% 33% 5044 38% 50% 50% 50% 50% 48% 50% 44% 30% % Reduction in Loss 47% 56% 33% 389 50% 295 38% 41% 35% 5096 20% 46% 23% 4396 50% 52N 12% 5156 % 0% 0% 8% 0% 54% SON 12% 589 50% 51% ware of your or your b. Chart for parti conditional formating data centage reduction of time, and uction with each percentage reduction bound of the percentages on the hels, ged, and properly You recommend for an Co Under which priciple of AZ 2 Template + 38% NNNN % Time % Reduction in 1 Control Reduction Loss 2 Anti-fraud policy 50% 47% 3 Code of conduct 46% 56% 14 Dedicated fraud department, function, or team 40% 33% .5 Employee support programs 33% 38% 16 External audit of controls over financial reporting 50% 50% 117 External audit of financial statements 29% 18 Formal fraud risk assessment 50% 38% 19 Fraud training for employees 50% 41% 20 Fraud training for managers/executives 50% 35% 21 Hotline 50% 50% 22 Independent audit committee 48% 20% 23 Internal audit department 50% 46% 24 Job rotation/mandatory vacation 44% 23% 25 Management certification of financial statements 50% 43% 26 Management review 50% 50% 27 Proactive data monitoring/analysis 58% 52% 28 Rewards for whistleblowers 50% 12% 29 Surprise audits 54% 51% 30 31 Instructions 32 There are four parts to this problem. Use Excel or the visualization software of your or your 33 instructor's choice to perform the following: 34 The data have been duplicated in the Student Work Area. Use conditional formatting data 35 bars for the data in both columns Sort this data by largest percentage reduction of time, and 36 then as a secondary sort, by the largest percentage of loss reduction. 37 b. Create a column chart comparing the two data items in part a, with each percentage reduction in a separate column for each control. Change the maximum bound of the percentages on the 40 vertical axis to 60%. Include a descriptive chart title, axes labels, legend, and properly formatted axes. Which controls are the most effective? What control would you recommend for an organization for which you are seeking employment? Identify the most effective control based on both time and cost. Under which principle of 45 control activities do you think this falls? Explain. a. 38 39 41 42 43 C. WN d. 46 47 48 49