Answered step by step
Verified Expert Solution
Link Copied!

Question

1 Approved Answer

need some.hp with this spreadsheet please AutoSave (O Off) H . = BMG275_Mod 14 Creating & Interpreting Control Charts (2) - Ex File Home Insert

need some.hp with this spreadsheet please
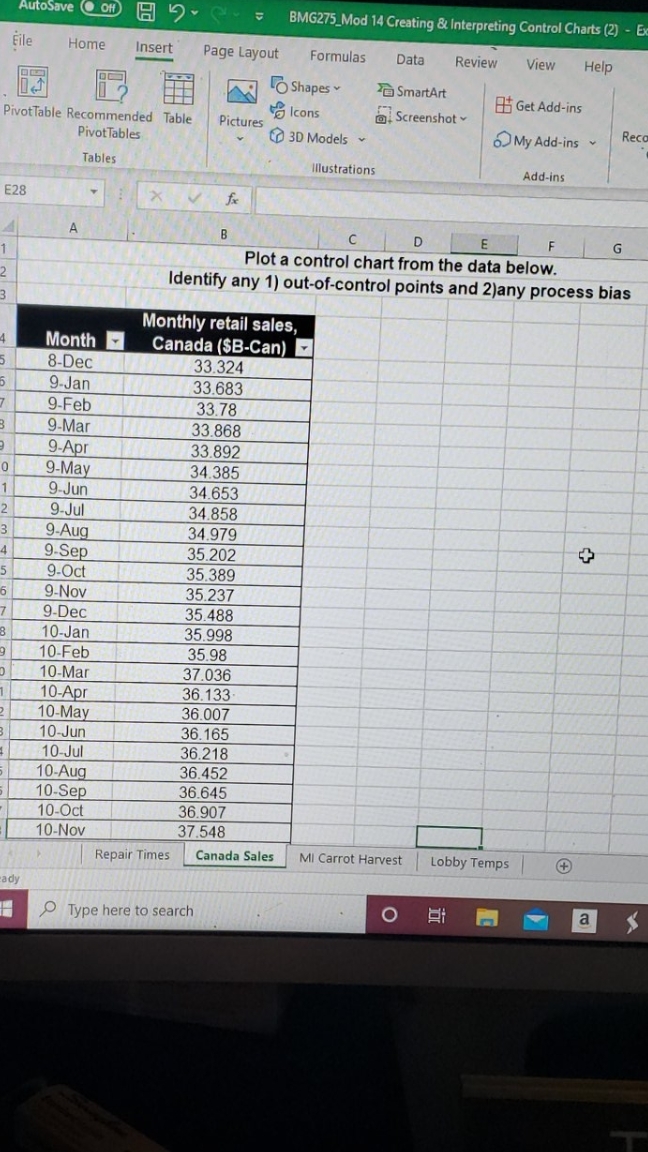
image text in transcribed
AutoSave (O Off) H . = BMG275_Mod 14 Creating & Interpreting Control Charts (2) - Ex File Home Insert Page Layout Formulas Data Review View Help Shapes SmartArt Get Add-ins PivotTable Recommended Table Pictures Icons a Screenshot PivotTables 3D Models My Add-ins Reco Tables Illustrations Add-ins E28 X V fx A B C D E F G Plot a control chart from the data below. Identify any 1) out-of-control points and 2)any process bias Monthly retail sales, Month Canada ($B-Can) 8-Dec 33.324 9-Jan 33.683 9-Feb 33.78 9-Mar 33.868 9-Apr 33.892 9-May 34.385 9-Jun 34.653 9-Jul 34.858 9-Aug 34.979 9-Sep 35.202 + 9-Oct 35.389 9-Nov 35.237 9-Dec 35.488 10-Jan 35.998 10-Feb 35.98 10-Mar 37.036 10-Apr 36.133 10-May 36.007 10-Jun 36. 165 10-Jul 36.218 10-Aug 36.452 10-Sep 36.645 10-Oct 36.907 10-Nov 37.548 Repair Times Canada Sales MI Carrot Harvest Lobby Temps + ady Type here to search O a

Step by Step Solution

There are 3 Steps involved in it

Step: 1

blur-text-image

Get Instant Access to Expert-Tailored Solutions

See step-by-step solutions with expert insights and AI powered tools for academic success

Step: 2

blur-text-image_2

Step: 3

blur-text-image_3

Ace Your Homework with AI

Get the answers you need in no time with our AI-driven, step-by-step assistance

Get Started

Recommended Textbook for

Management

Authors: Chuck Williams

4th Edition

978-0324316797, 0324316798

More Books

Students also viewed these General Management questions