

Answered step by step
Verified Expert Solution
Question
1 Approved Answer
Need step by step For this assignment, please use excel file group_assignment_1_portfolios.xls posted on blackboard under the folder of Excel Files. The file contains the
Need step by step
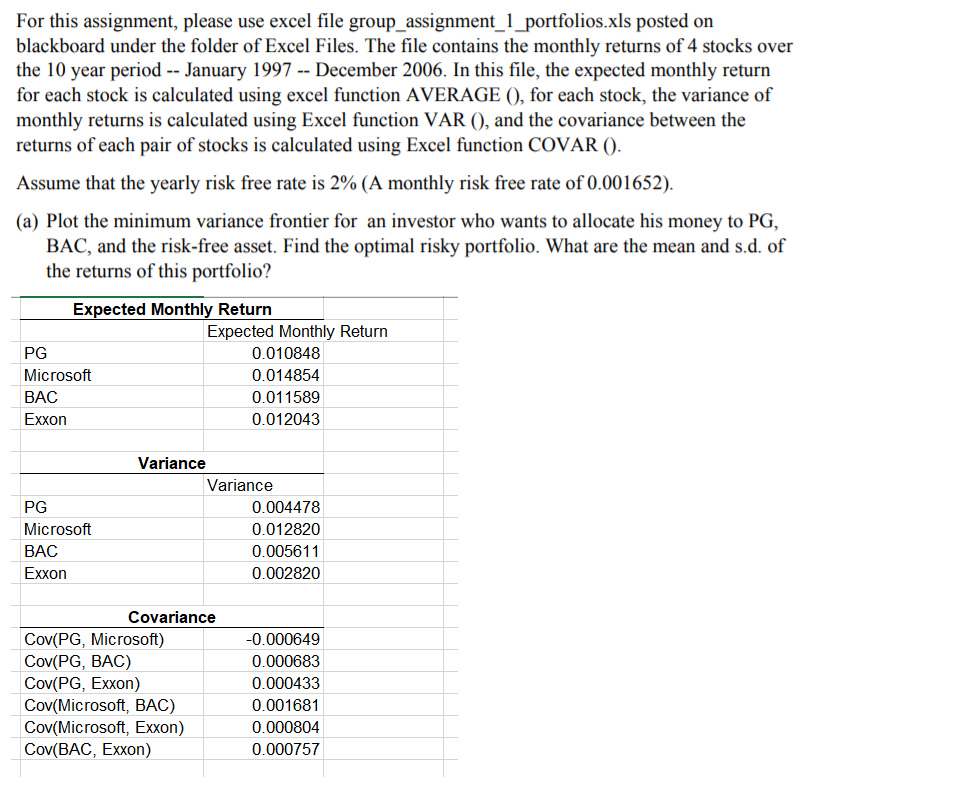
For this assignment, please use excel file group_assignment_1_portfolios.xls posted on blackboard under the folder of Excel Files. The file contains the monthly returns of 4 stocks over the 10 year period -- January 1997 -- December 2006. In this file, the expected monthly return for each stock is calculated using excel function AVERAGE O, for each stock, the variance of monthly returns is calculated using Excel function VAR (), and the covariance between the returns of each pair of stocks is calculated using Excel function COVAR O. Assume that the yearly risk free rate is 2% (A monthly risk free rate of 0.001652). (a) Plot the minimum variance frontier for an investor who wants to allocate his money to PG, BAC, and the risk-free asset. Find the optimal risky portfolio. What are the mean and s.d. of the returns of this portfolio? Expected Monthly Return Expected Monthly Return PG 0.010848 Microsoft 0.014854 BAC 0.011589 Exxon 0.012043 PG Microsoft BAC Exxon Variance Variance 0.004478 0.012820 0.005611 0.002820 Covariance Cov(PG, Microsoft) Cov(PG, BAC) Cov(PG, Exxon) Cov(Microsoft, BAC) Cov(Microsoft, Exxon) Cov(BAC, Exxon) -0.000649 0.000683 0.000433 0.001681 0.000804 0.000757 For this assignment, please use excel file group_assignment_1_portfolios.xls posted on blackboard under the folder of Excel Files. The file contains the monthly returns of 4 stocks over the 10 year period -- January 1997 -- December 2006. In this file, the expected monthly return for each stock is calculated using excel function AVERAGE O, for each stock, the variance of monthly returns is calculated using Excel function VAR (), and the covariance between the returns of each pair of stocks is calculated using Excel function COVAR O. Assume that the yearly risk free rate is 2% (A monthly risk free rate of 0.001652). (a) Plot the minimum variance frontier for an investor who wants to allocate his money to PG, BAC, and the risk-free asset. Find the optimal risky portfolio. What are the mean and s.d. of the returns of this portfolio? Expected Monthly Return Expected Monthly Return PG 0.010848 Microsoft 0.014854 BAC 0.011589 Exxon 0.012043 PG Microsoft BAC Exxon Variance Variance 0.004478 0.012820 0.005611 0.002820 Covariance Cov(PG, Microsoft) Cov(PG, BAC) Cov(PG, Exxon) Cov(Microsoft, BAC) Cov(Microsoft, Exxon) Cov(BAC, Exxon) -0.000649 0.000683 0.000433 0.001681 0.000804 0.000757Step by Step Solution
There are 3 Steps involved in it
Step: 1

Get Instant Access to Expert-Tailored Solutions
See step-by-step solutions with expert insights and AI powered tools for academic success
Step: 2

Step: 3
Ace Your Homework with AI
Get the answers you need in no time with our AI-driven, step-by-step assistance
Get Started
Financial Terms Dictionary Investment Terminology Explained
Authors: Thomas Herold, Wesley Crowder
1st Edition
1521725764, 978-1521725764