Answered step by step
Verified Expert Solution
Link Copied!

Question

1 Approved Answer

Need step by step to solve this Based on this dataset, find the adjusted gain ratio from Shape.? Find the adjusted gain ratio from Color.?

Need step by step to solve this

Based on this dataset, find the adjusted gain ratio from Shape.?

Find the adjusted gain ratio from Color.?

Find the adjusted gain ratio from Odor.?

If you want to discretize (categorize) Diameter, which boundary gives you the highest adjusted gain ratio?(If the boundary isx, then there are two groups, one with Diameter less than or equal tox, and another with Diameter greater thanx. Therefore, your task is to determine the best possible value ofxfor this dataset.)?

If you are building a C4.5 (J48 in WEKA) decision tree, what should be the root node?
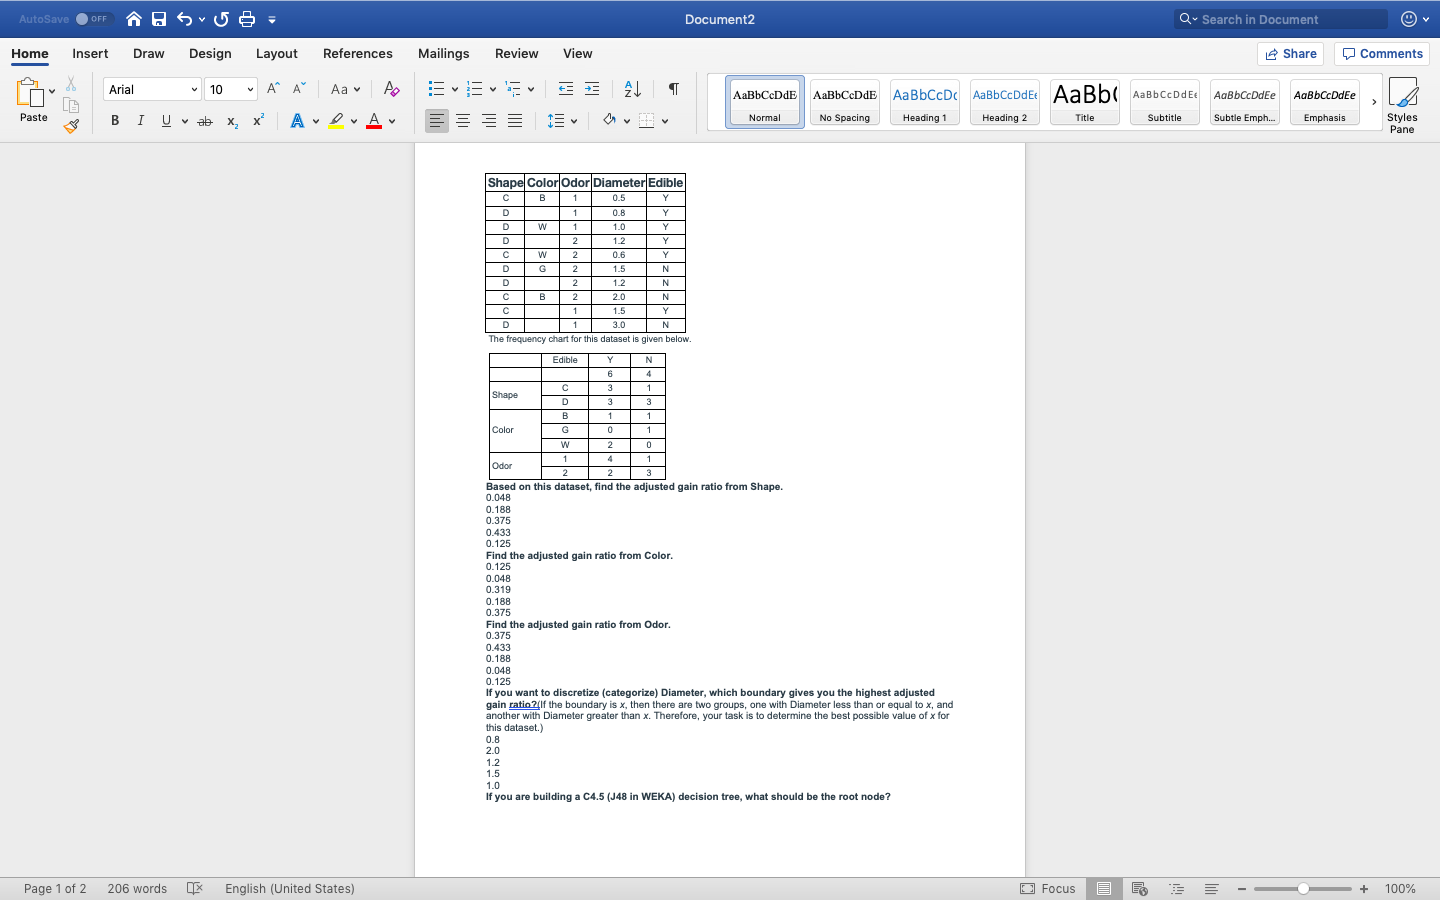
image text in transcribed
AutoSave O OFF ~ 4 6 . 6 6 - Document2 Q . Search in Document Home Insert Draw Design Layout References Mailings Review View Share Comments Arial * 10 A" A" Aa A T AaBbCcDdE AaBbCcDdE AaBbCcDc AaBbCcDdE AaBb( AaBbCcDdEt AaBbCcDdEe AaBbCcDdEe Paste BI U ab X x A LA Normal No Spacing Heading 1 Heading 2 Title Subtitle Subtle Emph Emphasis Styles Pane Shape Color Odor Diameter Edible C 0.5 0.8 1.0 W 1.2 0. 6 D 1.5 1.2 3.0 The frequency chart for this dataset is given below. Edible Shape Color Odor Based on this dataset, find the adjusted gain ratio from Shape. 0.04 0.188 0.37 0.433 0.12 0.125 Find the adjusted gain ratio from Color. 0.048 0.319 0.18 0.375 Find the adjusted gain ratio from Odor. 0.375 0.433 0.18 0.04 0.125 If you want to discretize (categorize) Diameter, which boundary gives you the highest adjusted gain ratio ?(If the boundary is x, then there are two groups, one with Diameter less than or equal to x, and another with Diameter greater than x. Therefore, your task is to determine the best possible value of x for this dataset.) 0.8 2.0 1.2 1.5 1.0 If you are building a C4.5 (J48 in WEKA) decision tree, what should be the root node? Page 1 of 2 206 words X English (United States) Focus E + 100%

Step by Step Solution

There are 3 Steps involved in it

Step: 1

blur-text-image

Get Instant Access to Expert-Tailored Solutions

See step-by-step solutions with expert insights and AI powered tools for academic success

Step: 2

blur-text-image

Step: 3

blur-text-image

Ace Your Homework with AI

Get the answers you need in no time with our AI-driven, step-by-step assistance

Get Started

Recommended Textbook for

Quantitative Analysis For Management

Authors: Barry Render, Ralph M. Stair, Michael E. Hanna

11th Edition

9780132997621, 132149117, 132997622, 978-0132149112

Students also viewed these Mathematics questions