

Answered step by step
Verified Expert Solution
Question
1 Approved Answer
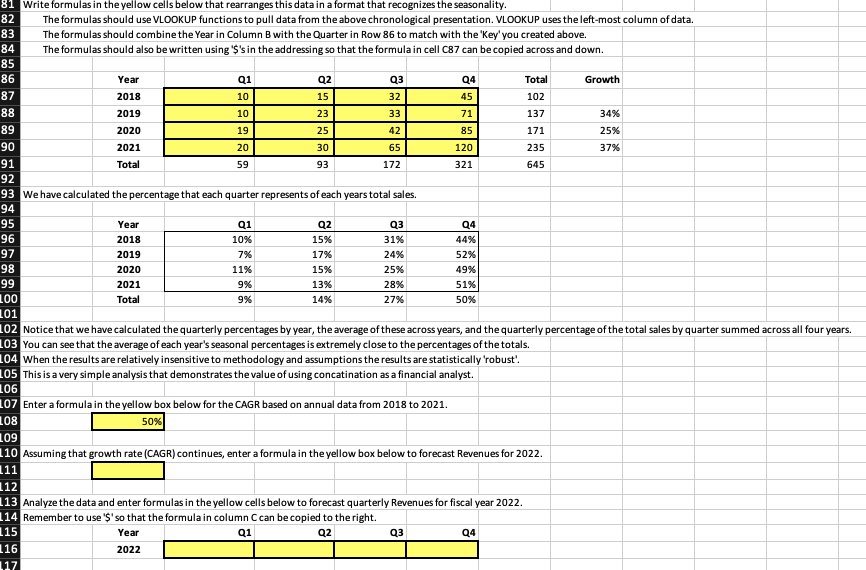
need the bottom portion. cheers Q1 81 Write formulas in the yellow cells below that rearranges this data in a format that recognizes the seasonality.
need the bottom portion. cheers
Q1 81 Write formulas in the yellow cells below that rearranges this data in a format that recognizes the seasonality. 82 The formulas should use VLOOKUP functions to pull data from the above chronological presentation. VLOOKUP uses the left-most column of data. 83 The formulas should combine the Year in Column B with the Quarter in Row 86 to match with the 'Key' you created above. 84 The formulas should also be written using 'S's in the addressing so that the formula in cell C87 can be copied across and down. 85 86 Year Q2 93 Q4 Total Growth 87 2018 10 15 32 45 102 88 2019 10 23 33 71 137 34% 89 2020 19 25 42 85 171 25% 90 2021 20 30 65 120 235 37% 91 Total 59 93 172 321 645 92 93 We have calculated the percentage that each quarter represents of each years total sales. 94 95 Year Q1 Q2 Q3 Q4 96 2018 10% 15% 31% 44% 97 2019 7% 17% 24% 52% 98 2020 11% 15% 25% 49% 99 2021 9% 13% 28% 51% 100 Total 9% 14% 27% 50% 101 L02 Notice that we have calculated the quarterly percentages by year, the average of these across years, and the quarterly percentage of the total sales by quarter summed across all four years. L03 You can see that the average of each year's seasonal percentages is extremely close to the percentages of the totals. L04 When the results are relatively insensitive to methodology and assumptions the results are statistically 'robust'. L05 This is a very simple analysis that demonstrates the value of using concatination as a financial analyst. 106 L07 Enter a formula in the yellow box below for the CAGR based on annual data from 2018 to 2021. 108 50% 109 110 Assuming that growth rate (CAGR) continues, enter a formula in the yellow box below to forecast Revenues for 2022. 111 112 113 Analyze the data and enter formulas in the yellow cells below to forecast quarterly Revenues for fiscal year 2022. 114 Remember to use 'S' so that the formula in column C can be copied to the right. 115 Year Q1 Q2 Q3 Q4 116 2022 17 Q1 81 Write formulas in the yellow cells below that rearranges this data in a format that recognizes the seasonality. 82 The formulas should use VLOOKUP functions to pull data from the above chronological presentation. VLOOKUP uses the left-most column of data. 83 The formulas should combine the Year in Column B with the Quarter in Row 86 to match with the 'Key' you created above. 84 The formulas should also be written using 'S's in the addressing so that the formula in cell C87 can be copied across and down. 85 86 Year Q2 93 Q4 Total Growth 87 2018 10 15 32 45 102 88 2019 10 23 33 71 137 34% 89 2020 19 25 42 85 171 25% 90 2021 20 30 65 120 235 37% 91 Total 59 93 172 321 645 92 93 We have calculated the percentage that each quarter represents of each years total sales. 94 95 Year Q1 Q2 Q3 Q4 96 2018 10% 15% 31% 44% 97 2019 7% 17% 24% 52% 98 2020 11% 15% 25% 49% 99 2021 9% 13% 28% 51% 100 Total 9% 14% 27% 50% 101 L02 Notice that we have calculated the quarterly percentages by year, the average of these across years, and the quarterly percentage of the total sales by quarter summed across all four years. L03 You can see that the average of each year's seasonal percentages is extremely close to the percentages of the totals. L04 When the results are relatively insensitive to methodology and assumptions the results are statistically 'robust'. L05 This is a very simple analysis that demonstrates the value of using concatination as a financial analyst. 106 L07 Enter a formula in the yellow box below for the CAGR based on annual data from 2018 to 2021. 108 50% 109 110 Assuming that growth rate (CAGR) continues, enter a formula in the yellow box below to forecast Revenues for 2022. 111 112 113 Analyze the data and enter formulas in the yellow cells below to forecast quarterly Revenues for fiscal year 2022. 114 Remember to use 'S' so that the formula in column C can be copied to the right. 115 Year Q1 Q2 Q3 Q4 116 2022 17Step by Step Solution
There are 3 Steps involved in it
Step: 1

Get Instant Access to Expert-Tailored Solutions
See step-by-step solutions with expert insights and AI powered tools for academic success
Step: 2

Step: 3
Ace Your Homework with AI
Get the answers you need in no time with our AI-driven, step-by-step assistance
Get Started
Your Financial Future How To Take Control Of Your Financial Future
Authors: Deloris Lutke
1st Edition
979-8388730831