NEED THIS ONE ASAP PLEASE HELP.
Compute the calendar quarter to next calendar quarter changes in:
- Revenues
- Cost-of-revenues
- Gross profit
- Income (loss) from operations
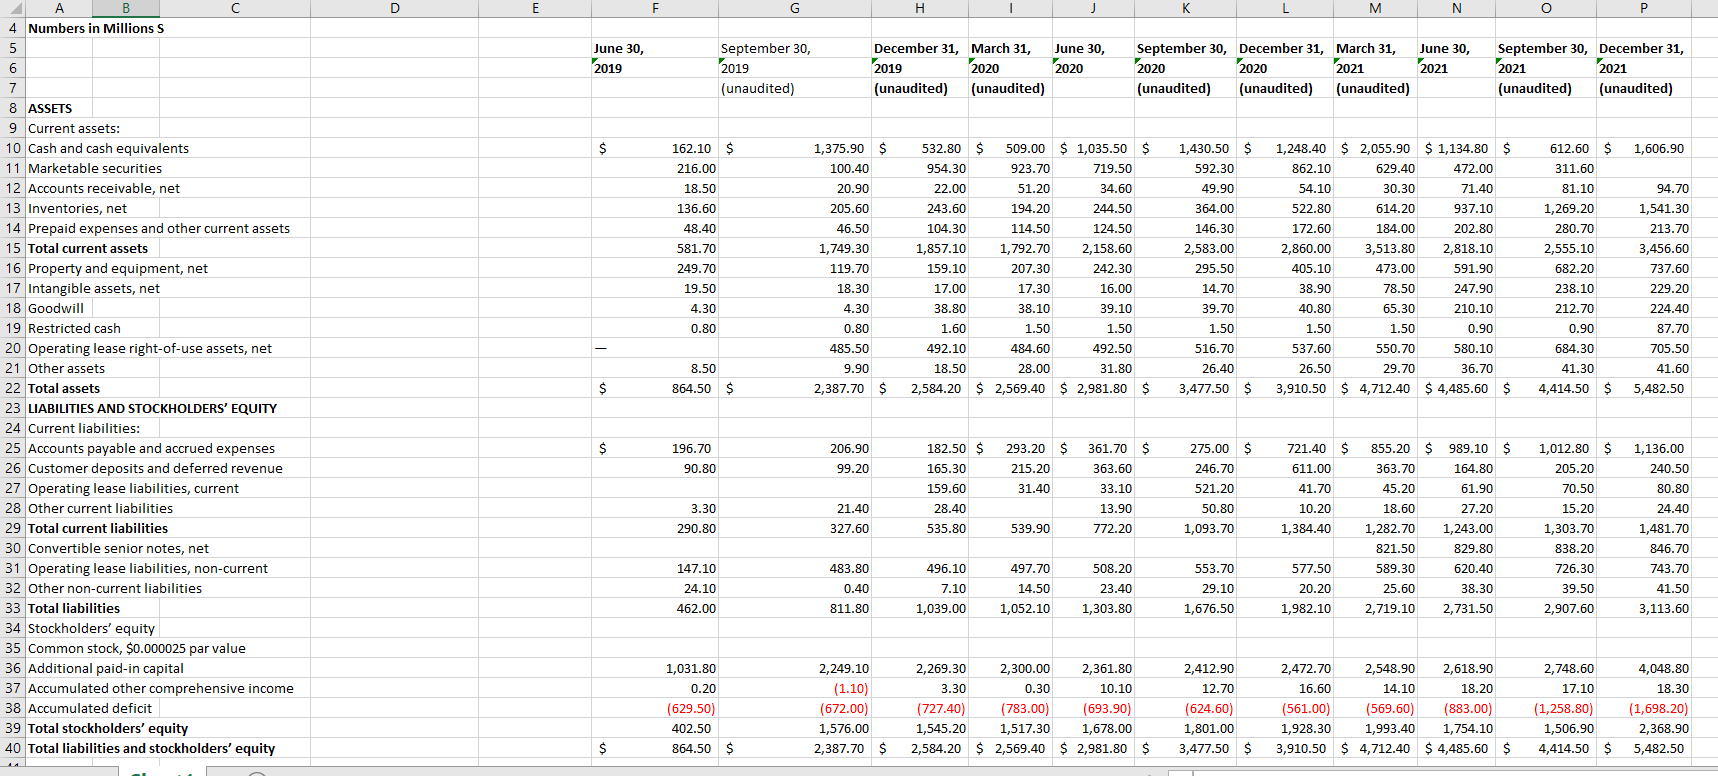
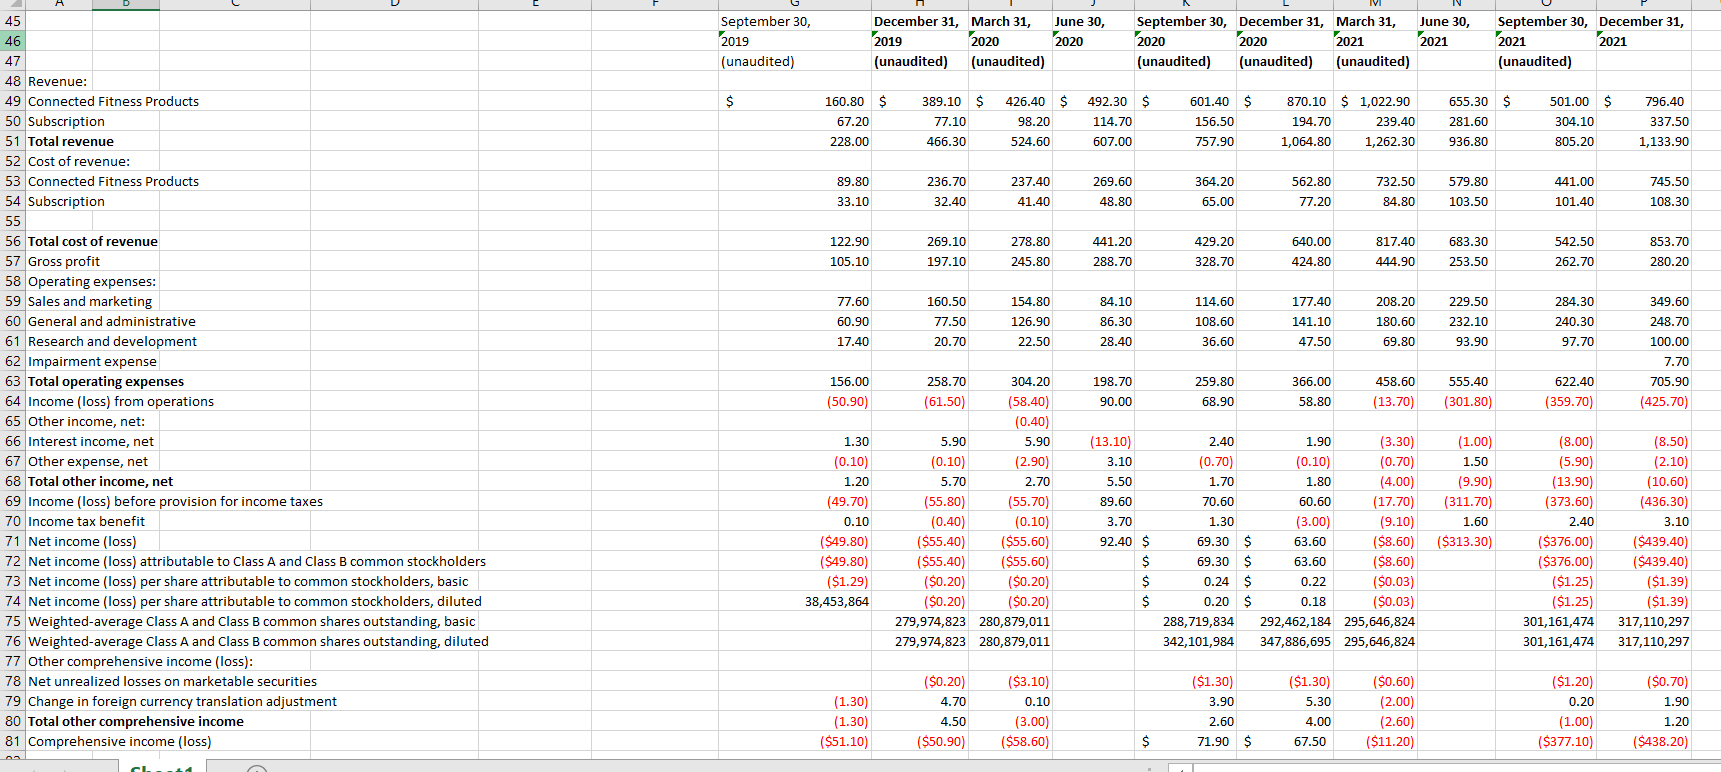
D E F G H K L M N o June 30, 2019 September 30, 2019 (unaudited) December 31, March 31, 2019 2020 (unaudited) (unaudited) June 30, 2020 September 30, December 31, March 31, June 30, 2020 2020 2021 2021 (unaudited) (unaudited) (unaudited) September 30, December 31, 2021 2021 (unaudited) (unaudited) $ 1,606.90 162.10 $ 216.00 18.50 136.60 48.40 1,375.90 $ 100.40 20.90 205.60 46.50 1,749.30 119.70 18.30 4.30 0.80 485.50 532.80 $ 954.30 22.00 243.60 104.30 1,857.10 159.10 509.00 $ 1,035.50 $ 923.70 719.50 51.20 34.60 194.20 244.50 114.50 124.50 1,792.70 2,158.60 207.30 242.30 17.30 16.00 1,430.50 $ 592.30 49.90 364.00 146.30 2,583.00 295.50 14.70 612.60 $ 311.60 81.10 1,269.20 280.70 2,555.10 682.20 581.70 249.70 94.70 1,541.30 213.70 3,456.60 737.60 1,248.40 $ 2,055.90 $ 1,134.80 $ 862.10 629.40 472.00 54.10 30.30 71.40 522.80 614.20 937.10 172.60 184.00 202.80 2,860.00 3,513.80 2,818.10 405.10 473.00 591.90 38.90 78.50 247.90 40.80 65.30 210.10 1.50 1.50 0.90 537.60 550.70 580.10 26.50 29.70 36.70 3,910.50 $ 4,712.40 $ 4,485.60 $ 19.50 238.10 229.20 224.40 4.30 38.10 39.10 39.70 212.70 17.00 38.80 1.60 492.10 0.80 1.50 1.50 1.50 516.70 0.90 684.30 87.70 705.50 484.60 492.50 9.90 26.40 41.30 A 4 Numbers in Millions S 5 6 6 7 8 ASSETS 8 9 Current assets: 10 Cash and cash equivalents 11 Marketable securities 12 Accounts receivable, net 13 Inventories, net 14 Prepaid expenses and other current assets 15 Total current assets 16 Property and equipment, net 17 Intangible assets, net 18 Goodwill 19 Restricted cash 20 Operating lease right-of-use assets, net 21 Other assets 22 Total assets 23 LIABILITIES AND STOCKHOLDERS' EQUITY 24 Current liabilities: 25 Accounts payable and accrued expenses 26 Customer deposits and deferred revenue 27 Operating lease liabilities, current 28 Other current liabilities 29 Total current liabilities 30 Convertible senior notes, net 31 Operating lease liabilities, non-current 32 Other non-current liabilities 33 Total liabilities 34 Stockholders' equity 35 Common stock, $0.000025 par value 36 Additional paid-in capital 37 Accumulated other comprehensive income 38 Accumulated deficit 39 Total stockholders' equity 40 Total liabilities and stockholders' equity 41.60 8.50 864.50 $ 18.50 28.00 31.80 2,584.20 $ 2,569.40 $ 2,981.80 $ $ 2,387.70 $ 3,477.50 $ 4,414.50 $ 5,482.50 $ 196.70 90.80 206.90 99.20 182.50 $ 165.30 159.60 28.40 535.80 293.20 $ 215.20 31.40 361.70 $ 363.60 33.10 13.90 772.20 275.00 $ 246.70 521.20 50.80 1,093.70 721.40 $ 611.00 41.70 10.20 1,384.40 3.30 290.80 21.40 327.60 539.90 855.20 $ 363.70 45.20 18.60 1,282.70 821.50 589.30 25.60 2,719.10 989.10 $ 164.80 61.90 27.20 1,243.00 829.80 620.40 38.30 2,731.50 1,012.80 $ 205.20 70.50 15.20 1,303.70 838.20 726.30 39.50 2,907.60 1,136.00 240.50 80.80 24.40 1,481.70 846.70 743.70 41.50 3,113.60 483.80 147.10 24.10 462.00 0.40 496.10 7.10 1,039.00 497.70 14.50 1,052.10 508.20 23.40 1,303.80 553.70 29.10 1,676.50 577.50 20.20 1,982.10 811.80 1,031.80 0.20 (629.50) 402.50 864.50 $ 2,249.10 (1.10) (672.00) 1,576.00 2,387.70 $ 2,269.30 2,300.00 2,361.80 3.30 0.30 10.10 (727.40) (783.00) (693.90) 1,545.20 1,517.30 1,678.00 2,584.20 $ 2,569.40 $ 2,981.80 $ 2,412.90 12.70 (624.60) 1,801.00 3,477.50 $ 2,472.70 2,548.90 2,618.90 16.60 14.10 18.20 (561.00) (569.60) (883.00) 1,928.30 1,993.40 1,754.10 3,910.50 $ 4,712.40 $ 4,485.60 $ 2,748.60 17.10 (1,258.80) 1,506.90 4,414.50 $ 4,048.80 18.30 (1,698.20) 2,368.90 5,482.50 $ June 30, September 30, 2019 (unaudited) December 31, March 31, 2019 2020 (unaudited) (unaudited) June 30, 2020 2020 September 30, December 31, March 31, 2020 2021 (unaudited) (unaudited) (unaudited) 2021 September 30, December 31, 2021 (unaudited) 2021 $ 655.30 $ 160.80 $ 67.20 228.00 389.10 $ 77.10 466.30 426.40 $ 492.30 $ 98.20 114.70 524.60 607.00 601.40 $ 156.50 757.90 870.10 $ 1,022.90 194.70 239.40 1,064.80 1,262.30 281.60 501.00 $ 304.10 805.20 796.40 337.50 1,133.90 936.80 89.80 236.70 237.40 364.20 562.80 732.50 441.00 745.50 269.60 48.80 579.80 103.50 33.10 32.40 41.40 65.00 77.20 84.80 101.40 108.30 429.20 122.90 105.10 269.10 197.10 278.80 245.80 441.20 288.70 640.00 424.80 817.40 444.90 683.30 253.50 542.50 262.70 853.70 280.20 328.70 77.60 160.50 84.10 177.40 284.30 349.60 60.90 17.40 154.80 126.90 22.50 208.20 180.60 77.50 20.70 114.60 108.60 36.60 86.30 28.40 141.10 47.50 229.50 232.10 93.90 240.30 97.70 248.70 100.00 69.80 45 46 47 48 Revenue: 49 Connected Fitness Products 50 Subscription 51 Total revenue 52 Cost of revenue: 53 Connected Fitness Products 54 Subscription 55 56 Total cost of revenue 57 Gross profit 58 Operating expenses: 59 Sales and marketing 60 General and administrative 61 Research and development 62 Impairment expense 63 Total operating expenses 64 Income (loss) from operations 65 Other income, net: 66 Interest income, net 67 Other expense, net 68 Total other income, net 69 Income (loss) before provision for income taxes 70 Income tax benefit 71 Net income (loss) 72 Net income (loss) attributable to Class A and Class B common stockholders 73 Net income (los) per share attributable to common stockholders, basic 74 Net income (loss) per share attributable to common stockholders, diluted 75 Weighted-average Class A and Class B common shares outstanding, basic 76 Weighted average Class A and Class B common shares outstanding, diluted 77 Other comprehensive income (loss): 78 Net unrealized losses on marketable securities 79 Change in foreign currency translation adjustment 80 Total other comprehensive income 81 Comprehensive income (loss) 198.70 259.80 366.00 458.60 555.40 156.00 (50.90) 622.40 (359.70) 7.70 705.90 (425.70) 90.00 68.90 58.80 (13.70) (301.80) 2.40 (0.70) 1.70 1.30 (0.10) 1.20 (49.70) 0.10 ($49.80) ($49.80) ($1.29) 38,453,864 70.60 258.70 304.20 (61.50) (58.40) (0.40) 5.90 5.90 (0.10) (2.90) 5.70 2.70 (55.80) (55.70) (0.40) (0.10) ($55.40) ($55.60) ($55.40) ($55.60) ($0.20) ($0.20) ($0.20) ($0.20) 279,974,823 280,879,011 279,974,823 280,879,011 (13.10) 3.10 5.50 89.60 3.70 92.40 $ $ $ $ $ (1.00) 1.50 (9.90) (311.70) 1.60 ($313.30) 1.90 (3.30) (0.10) (0.70) 1.80 (4.00) 60.60 (17.70) (3.00) (9.10) 63.60 ($8.60) 63.60 ($8.60) 0.22 ($0.03) 0.18 ($0.03) 292,462,184 295,646,824 347,886,695 295,646,824 1.30 69.30 $ 69.30 $ 0.24 $ 0.20 $ 288,719,834 342,101,984 (8.00) (5.90) (13.90) (373.60) 2.40 ($376.00) ($376.00) ($1.25) ($1.25) 301,161,474 301,161,474 (8.50) (2.10) (10.60) (436.30) 3.10 ($439.40) ($439.40) ($1.39) ($1.39) 317,110,297 317,110,297 ($0.70) ($1.30) 5.30 1.90 (1.30) (1.30) ($51.10) ($0.20) 4.70 4.50 ($50.90) ($3.10) 0.10 (3.00) ($58.60) ($1.30) 3.90 2.60 71.90 $ ($0.60) (2.00) (2.60) ($11.20) ($1.20) ) 0.20 (1.00) ($377.10) 4.00 1.20 ($438.20) $ 67.50