Answered step by step
Verified Expert Solution
Question
1 Approved Answer
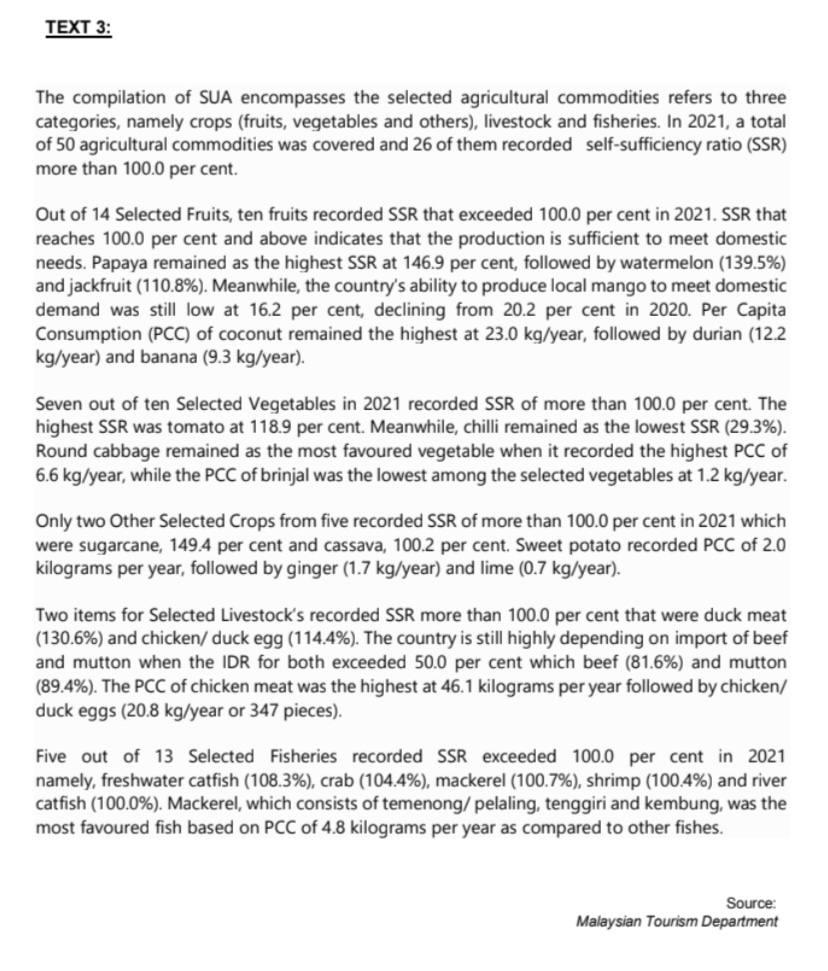
Need to transform the data to most suitable chart/pie/line graph/bar graph or others based in the article. 2. Give effect and recommendation for this issues
Need to transform the data to most suitable chart/pie/line graph/bar graph or others based in the article.
2. Give effect and recommendation for this issues


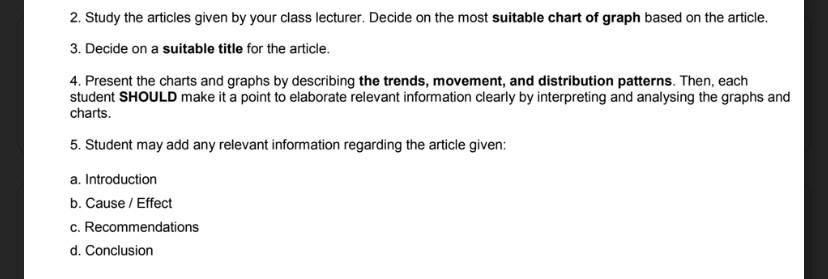
2. Study the articles given by your class lecturer. Decide on the most suitable chart of graph based on the article. 3. Decide on a suitable title for the article. 4. Present the charts and graphs by describing the trends, movement, and distribution patterns. Then, each student SHOULD make it a point to elaborate relevant information clearly by interpreting and analysing the graphs and charts. 5. Student may add any relevant information regarding the article given: a. Introduction b. Cause / Effect c. Recommendations d. Conclusion
Step by Step Solution
There are 3 Steps involved in it
Step: 1
Based on the given article the most suitable chartsgraphs for presenting the data are as follows Pie Chart A pie chart can be used to show the distribution of agricultural commodities based on the thr...
Get Instant Access to Expert-Tailored Solutions
See step-by-step solutions with expert insights and AI powered tools for academic success
Step: 2

Step: 3

Ace Your Homework with AI
Get the answers you need in no time with our AI-driven, step-by-step assistance
Get Started


