

Question: Need typed answer:- Quality ControlThe quality-control manager of a candy company wants to discover whether a filling machine over- or underfills 16-ounce bags randomly. The
Need typed answer:-
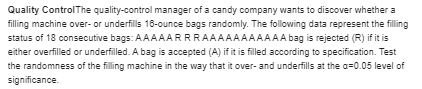
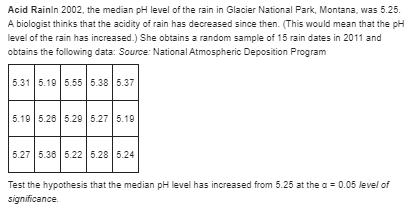
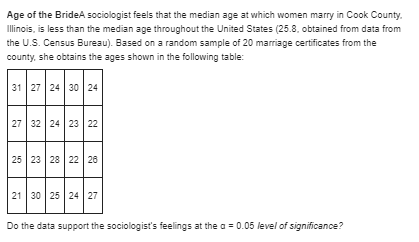
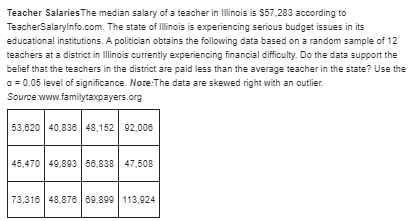
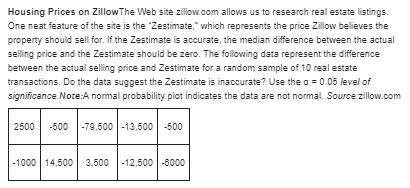
Quality ControlThe quality-control manager of a candy company wants to discover whether a filling machine over- or underfills 16-ounce bags randomly. The following data represent the filling status of 18 consecutive bags: AAAAAR R RAAAAAAAAAAA bag is rejected (R) if it is either overfilled or underfilled. A bag is accepted (A) if it is filled according to specification. Test the randomness of the filling machine in the way that it over- and underfills at the a=0.05 level of significance.\fRandom-Number GeneratorsUsing statistical software or a graphing calculator with advanced statistics features, randomly generate a sequence of 20 integer values, each either 0 or 1. Conduct a runs test at the o= 0.05 level of significance to verify that the sequence of integers is random.Mustrate the use of the sign test to test hypotheses regarding a population proportion The only requirement for the sign test is that our sample beobtained randomly. When dealing with nominal data, we canidentify a characteristic of interest and then determine whethereach individual in the sample possesses this characteristic. Underthe null hypothesis in the sign test, we expect that half of the datawill result in minus signs and half in plus signs. If we let a plussign indicate the presence of the characteristic (and a minus sign indicate the absence), we expect half of our sample to possess thecharacteristic while the other half will not Letting prepresent theproportion of the population that possesses the characteristic, ournull hypothesis will be HD: p= 0.5. Use the sign test for Problems17 and 18, following the sign convention indicated previously. Women GamersA study of 100 randomly selected computer and video game players found that 38 were women (based on data from the Entertainment Software Association, 2007). Using an a = 0.01 level of significance, does this indicate that less than 50%% of gamers are women?Mustrate the use of the sign test to test hypotheses regarding a population proportion The only requirement for the sign test is that our sample beobtained randomly. When dealing with nominal data, we canidentify a characteristic of interest and then determine whethereach individual in the sample possesses this characteristic. Underthe null hypothesis in the sign test, we expect that half of the datawill result in minus signs and half in plus signs. If we let a plussign indicate the presence of the characteristic (and a minus sign indicate the absence), we expect half of our sample to possess thecharacteristic while the other half will not. Letting prepresent theproportion of the population that possesses the characteristic, ournull hypothesis will be HD: p= 0.5. Use the sign test for Problems17 and 18, following the sign convention indicated previously. Trusting the Pressin a study of 2302 U.S. adults surveyed online by Harris Interactive 1243 respondents indicated that they tend to not trust the press. Using an o = 0.05 level of significance, does this indicate that more than half of U.S. adults tend to not trust the press?\fAcid RainIn 2002, the median p level of the rain in Glacier National Park, Montana, was 5.25. A biologist thinks that the acidity of rain has decreased since then. (This would mean that the pH level of the rain has increased.) She obtains a random sample of 15 rain dates in 2011 and obtains the following data: Source: National Atmospheric Deposition Program 5.31 5.19 15.55 5.38 5.37 5.10 5.26 5.20 5.27 5.19 5.27 5.36 5.22 5.28 5.24 Test the hypothesis that the median pH level has increased from 5.25 at the a = 0.05 level of Significance.Age of the BrideA sociologist feels that the median age at which women marry in Cook County. Illinois, is less than the median age throughout the United States (25.8. obtained from data from the U.S. Census Bureau). Based on a random sample of 20 marriage certificates from the county, she obtains the ages shown in the following table: 31 27 24 30 24 27 32 24 23 22 25 23 28 22 28 21 30 25 24 27 Do the data support the sociologist's feelings at the a = 0.05 level of significance?Teacher Salaries The median salary of a teacher in Illinois is $57,283 according to TeacherSalaryInfo.com. The state of Illinois is experiencing serious budget issues in its educational institutions. A politician obtains the following data based on a random sample of 12 teachers at a district in Illinois currently experiencing financial difficulty. Do the data support the belief that the teachers in the district are paid less than the average teacher in the state? Use the a = 0.05 level of significance. Note:The data are skewed right with an outlier. Source.www.familytaxpayers.org 53.620 40.836 48 152 92 006 45.470 49.893 58.838 47.508 73 318 48.876 69.899 113,924Housing Prices on ZillowThe Web site zillow.com allows us to research real estate listings. One neat feature of the site is the "Zestimate," which represents the price Zillow believes the property should sell for. If the Zestimate is accurate, the median difference between the actual selling price and the Zestimate should be zero. The following data represent the difference between the actual selling price and Zestimate for a random sample of 10 real estate transactions. Do the data suggest the Zestimate is inaccurate? Use the o = 0.05 level of significance. Note:A normal probability plot indicates the data are not normal. Source zillow.com 2500 -500 -79.500 -13.500 -500 -1000 14.500 3.500 -12 500 -6000
Step by Step Solution
There are 3 Steps involved in it

Get step-by-step solutions from verified subject matter experts