

Question
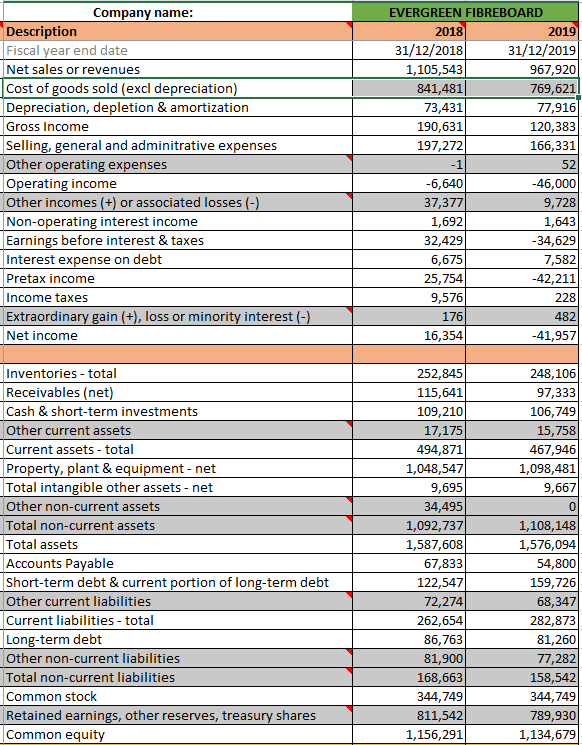
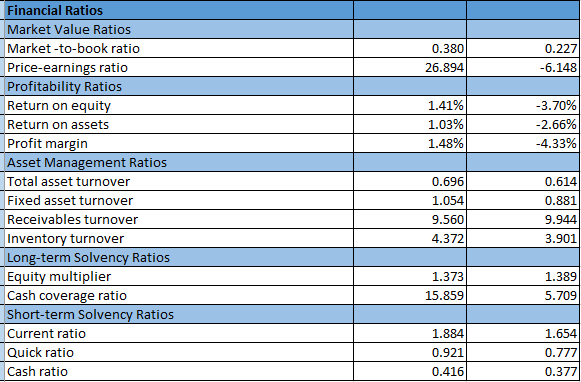
Next, describe, in particular, the companys (a) cost efficiency, (b) asset efficiency, (c) liquidity, (d) financial leverage (e) other factors reflecting investor confidence in 2019.
Next, describe, in particular, the companys
(a) cost efficiency,
(b) asset efficiency,
(c) liquidity,
(d) financial leverage
(e) other factors reflecting investor confidence in 2019.
In these, also describe the change in the above aspects in 2019, compared to 2018. For these, the financial statement data and financial ratios from the worksheet of the company would be the primary source of data.
Step by Step Solution
There are 3 Steps involved in it
Step: 1

Get Instant Access to Expert-Tailored Solutions
See step-by-step solutions with expert insights and AI powered tools for academic success
Step: 2

Step: 3
Ace Your Homework with AI
Get the answers you need in no time with our AI-driven, step-by-step assistance
Get Started
Makers And Takers The Rise Of Finance And The Fall Of American Business
Authors: Rana Foroohar
1st Edition
0553447238, 978-0553447231