- Next, identify each variance in the chart as to whether the manager had control over it, or if it was something beyond his control. Determine the operating performance of the manager based on the items he could control. Comment on the operating performance of each manager using this analysis as a base for discussion.
- Discuss the manner in which the transfer price was determined. Was it a fair way to determine the cost of the transfer? What other methods would you consider? Who has a vested interest in the transfer pricing calculation? Does corporate care? Do the different divisions care?
- Discuss the strategic implications of the French Divisions expanding side business of deliveries. List at least two benefits of doing this and at least two negatives that could happen if this business were expanded.
- Discuss what the corporate president should do with the Spanish division in regards to the performance evaluation. Calculate a few of the variances and ratios to support your recommendation as to whether the manager did a good job with the situation he was dealing with. How should a manager with an unusual situation such as faulty machinery be evaluated?
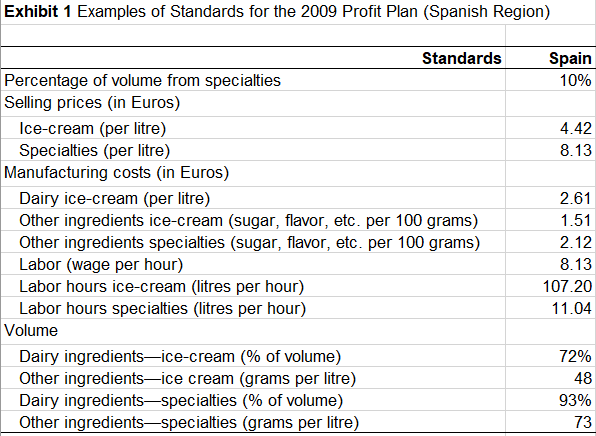
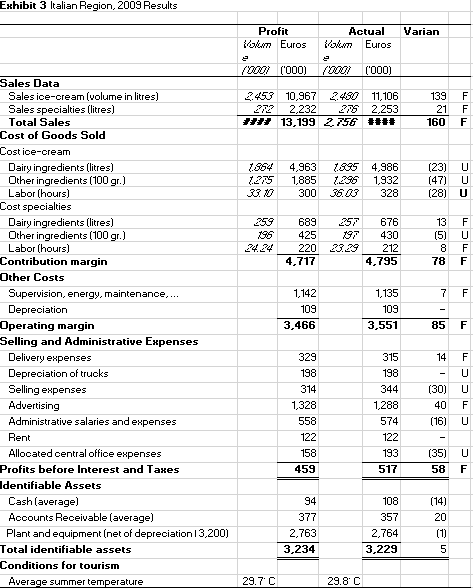
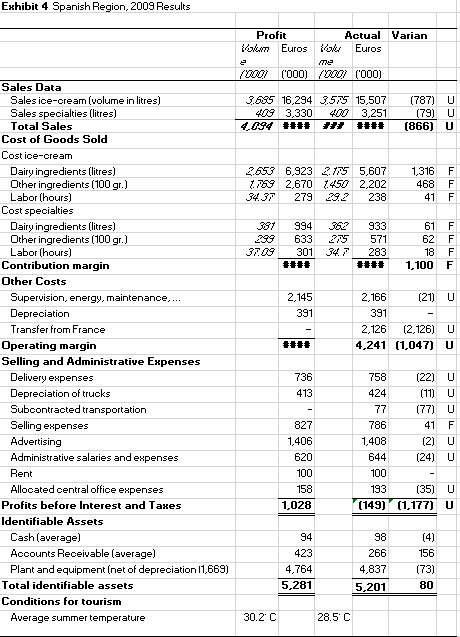
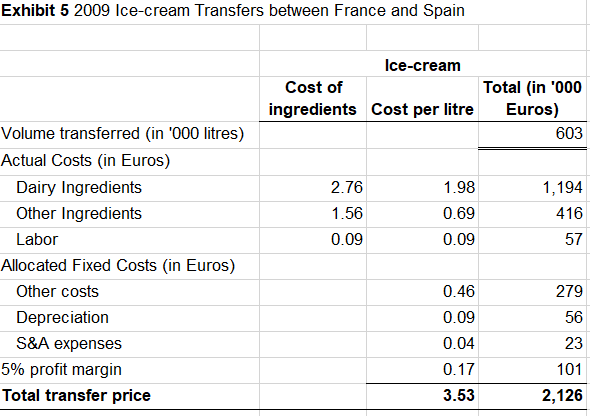
Exhibit 1 Examples of Standards for the 2009 Profit Plan (Spanish Region) Spain 10% 4.42 8.13 Standards Percentage of volume from specialties Selling prices (in Euros) Ice-cream (per litre) Specialties (per litre) Manufacturing costs (in Euros) Dairy ice-cream (per litre) Other ingredients ice-cream (sugar, flavor, etc. per 100 grams) Other ingredients specialties (sugar, flavor, etc. per 100 grams) Labor (wage per hour) Labor hours ice-cream (litres per hour) Labor hours specialties (litres per hour) Volume Dairy ingredients-ice-cream (% of volume) Other ingredients ice cream (grams per litre) Dairy ingredientsspecialties (% of volume) Other ingredientsspecialties (grams per litre) 2.61 1.51 2.12 8.13 107.20 11.04 72% 48 93% 73 Exhibit 3 Italian Region, 2009 Results Profit Kom Euros ActualVarian Kalm Euros (900 1000 10001 (000) 2453 272 *** 10.967 2.480 11,106 2.232 275 2,253 13,199 2.756 000 139 21 160 F F F 1.964 1275 300 4.963 1,885 300 1895 1.296 35.03 4,986 1,932 328 (23) (47) (28) U U U 689 425 257 197 676 430 212 13 (5) 8 78 F U F F 4,717 4,795 1.142 7 F 109 1,135 109 3,551 3,466 85 F Sales Data Sales ice-cream (volume in litres) Sales Specialties (litres) Total Sales Cost of Goods Sold Costice-cream Dairy ingredients (litres) Other ingredients (100 gr.) Labor (hours) Cost specialties Dairy ingredients (litres) Other ingredients (100 gr.) Labor (hours) Contribution margin Other Costs Supervision, energy, maintenance, ... Depreciation Operating margin Selling and Administrative Expenses Delivery expenses Depreciation of trucks Selling expenses Advertising Administrative salaries and expenses Rent Allocated central office expenses Profits before Interest and Taxes Identifiable Assets Cash (average) Accounts Receivable (average) Plant and equipment (net of depreciation 13,200) Total identifiable assets Conditions for tourism Average summer temperature 329 198 314 315 198 344 1,288 574 122 193 517 14 - (30) 40 (16) F U U F U 1,328 558 122 158 459 (35) 58 U F 94 (14) 20 377 2.763 3,234 108 357 2.764 3,229 5 29.7 C 29.8 C Exhibit 4 Spanish Region, 2009 Results Profit Actual Varian Yorum Euros Kol Euros 200 (000) 1000 (000) 3685 16,294 3575 15,507 409 3,330 400 3,251 4.094 #### 2 2010 (787) U (79) U (866) U 2653 6,923 2.175 1.759 2,670 1450 34.37 279 29.2 5,607 2,202 238 1,316 468 41 F F F 61 F 301 2299 3709 994 633 301 362 275 34. 7 933 571 283 62 F 18 1,100 F F 2.145 391 2,166 (21) U 391 2,126 (2,126) U 4,241 (1,047) U II Sales Data Sales ice-cream (volume in litres) Sales specialties (litres) Total Sales Cost of Goods Sold Cost ice-cream Dairy ingredients (litres) Other ingredients (100 gr.) Labor (hours) Cost specialties Dairy ingredients (litres) Other ingredients (100 gr.) Labor (hours) Contribution margin Other Costs Supervision, energy, maintenance,... Depreciation Transfer from France Operating margin Selling and Administrative Expenses Delivery expenses Depreciation of trucks Subcontracted transportation Selling expenses Advertising Administrative salaries and expenses Rent Allocated central office expenses Profits before Interest and Taxes Identifiable Assets Cash (average) Accounts Receivable (average) Plant and equipment (net of depreciation 11,669) Total identifiable assets Conditions for tourism Average summer temperature 736 413 827 1.406 620 100 158 1,028 758 (22) U 424 (11) U 77 (77) U 786 41 F 1,408 (2) U 644 (24) U 100 193 (35) U (149) (1,177) U 94 423 4,764 5,281 98 (4) 266 156 4,837 (73) 5,20180 30.2 C 28.5 C Exhibit 5 2009 Ice-cream Transfers between France and Spain Ice-cream Cost of Total (in '000 ingredients Cost per litre Euros) 603 2.76 1.56 0.09 1.98 0.69 0.09 1,194 416 57 Volume transferred (in '000 litres) Actual Costs (in Euros) Dairy Ingredients Other Ingredients Labor Allocated Fixed Costs (in Euros) Other costs Depreciation S&A expenses 5% profit margin Total transfer price 279 56 0.46 0.09 0.04 0.17 3.53 23 101 2,126 Exhibit 6 Historical Data-Temperature and Sales Volume Year 21.7 1995 1936 1997 1338 1399 2000 2001 2002 2003 2004 2005 2006 2007 2008 2009 (budget) Average France Teoperature Sales Yolene Volun. Groet (degrees Celsius) 1'000 litrea 1.344 1,435 6.7% 28.4 1,484 3.4% 30.9 1.714 15.5% 32.9 2,031 18.5% 27.3 1,384 -2.3% 30.0 2 208 11.34 30.5 2.489 12.73 30.8 2.761 10.94 2,998 8.6% 23.7 3.216 7.3% 30.3 3.445 7.1% 236 3.797 10.2% 4,087 7.6% 4.455 3.0% 23.8 C 9.12 30.0 Year 30.8 31.2 31.6 1995 1996 1997 1938 1939 2000 2001 2002 2003 2004 2005 2006 2007 2008 2009 (budget) Average Spain Temperature Sales Volume Volume Groot (degrees Celsius) ('000 litres) 1,069 1272 18.3% 29.0 1,402 10.2% 1.685 20.2% 23.8 1,052 9.9% 28.3 2,006 8.3% 26.0 1,364 2,033 3.54 23.9 9.82 2,481 11.2% 31.8 2.684 32.4 3.036 13.1% 30.4 3.346 310 3,722 113% 4,034 10.03 30.2 C 10.22 215 2.231 10 24 Year 30.4 Italy Temperature Sales Volume Volume Groot [degrees Celsius) roo0 litres 32.2 892 1,036 16.1% 28.6 1.143 10.3% 31.8 1,434 25.6% 1.508 5.12 28.2 1.639 8.7% 23.0 1,771 8.0% 26.3 1072 5.7% 30.1 2,090 30.0 2,433 2,725 12.0% 29.7 C 12.02 1999 2000 2001 2002 2003 2004 2005 2006 2007 2008 2003 (budget) Average 28.1 11.7% 16.43 Exhibit 1 Examples of Standards for the 2009 Profit Plan (Spanish Region) Spain 10% 4.42 8.13 Standards Percentage of volume from specialties Selling prices (in Euros) Ice-cream (per litre) Specialties (per litre) Manufacturing costs (in Euros) Dairy ice-cream (per litre) Other ingredients ice-cream (sugar, flavor, etc. per 100 grams) Other ingredients specialties (sugar, flavor, etc. per 100 grams) Labor (wage per hour) Labor hours ice-cream (litres per hour) Labor hours specialties (litres per hour) Volume Dairy ingredients-ice-cream (% of volume) Other ingredients ice cream (grams per litre) Dairy ingredientsspecialties (% of volume) Other ingredientsspecialties (grams per litre) 2.61 1.51 2.12 8.13 107.20 11.04 72% 48 93% 73 Exhibit 3 Italian Region, 2009 Results Profit Kom Euros ActualVarian Kalm Euros (900 1000 10001 (000) 2453 272 *** 10.967 2.480 11,106 2.232 275 2,253 13,199 2.756 000 139 21 160 F F F 1.964 1275 300 4.963 1,885 300 1895 1.296 35.03 4,986 1,932 328 (23) (47) (28) U U U 689 425 257 197 676 430 212 13 (5) 8 78 F U F F 4,717 4,795 1.142 7 F 109 1,135 109 3,551 3,466 85 F Sales Data Sales ice-cream (volume in litres) Sales Specialties (litres) Total Sales Cost of Goods Sold Costice-cream Dairy ingredients (litres) Other ingredients (100 gr.) Labor (hours) Cost specialties Dairy ingredients (litres) Other ingredients (100 gr.) Labor (hours) Contribution margin Other Costs Supervision, energy, maintenance, ... Depreciation Operating margin Selling and Administrative Expenses Delivery expenses Depreciation of trucks Selling expenses Advertising Administrative salaries and expenses Rent Allocated central office expenses Profits before Interest and Taxes Identifiable Assets Cash (average) Accounts Receivable (average) Plant and equipment (net of depreciation 13,200) Total identifiable assets Conditions for tourism Average summer temperature 329 198 314 315 198 344 1,288 574 122 193 517 14 - (30) 40 (16) F U U F U 1,328 558 122 158 459 (35) 58 U F 94 (14) 20 377 2.763 3,234 108 357 2.764 3,229 5 29.7 C 29.8 C Exhibit 4 Spanish Region, 2009 Results Profit Actual Varian Yorum Euros Kol Euros 200 (000) 1000 (000) 3685 16,294 3575 15,507 409 3,330 400 3,251 4.094 #### 2 2010 (787) U (79) U (866) U 2653 6,923 2.175 1.759 2,670 1450 34.37 279 29.2 5,607 2,202 238 1,316 468 41 F F F 61 F 301 2299 3709 994 633 301 362 275 34. 7 933 571 283 62 F 18 1,100 F F 2.145 391 2,166 (21) U 391 2,126 (2,126) U 4,241 (1,047) U II Sales Data Sales ice-cream (volume in litres) Sales specialties (litres) Total Sales Cost of Goods Sold Cost ice-cream Dairy ingredients (litres) Other ingredients (100 gr.) Labor (hours) Cost specialties Dairy ingredients (litres) Other ingredients (100 gr.) Labor (hours) Contribution margin Other Costs Supervision, energy, maintenance,... Depreciation Transfer from France Operating margin Selling and Administrative Expenses Delivery expenses Depreciation of trucks Subcontracted transportation Selling expenses Advertising Administrative salaries and expenses Rent Allocated central office expenses Profits before Interest and Taxes Identifiable Assets Cash (average) Accounts Receivable (average) Plant and equipment (net of depreciation 11,669) Total identifiable assets Conditions for tourism Average summer temperature 736 413 827 1.406 620 100 158 1,028 758 (22) U 424 (11) U 77 (77) U 786 41 F 1,408 (2) U 644 (24) U 100 193 (35) U (149) (1,177) U 94 423 4,764 5,281 98 (4) 266 156 4,837 (73) 5,20180 30.2 C 28.5 C Exhibit 5 2009 Ice-cream Transfers between France and Spain Ice-cream Cost of Total (in '000 ingredients Cost per litre Euros) 603 2.76 1.56 0.09 1.98 0.69 0.09 1,194 416 57 Volume transferred (in '000 litres) Actual Costs (in Euros) Dairy Ingredients Other Ingredients Labor Allocated Fixed Costs (in Euros) Other costs Depreciation S&A expenses 5% profit margin Total transfer price 279 56 0.46 0.09 0.04 0.17 3.53 23 101 2,126 Exhibit 6 Historical Data-Temperature and Sales Volume Year 21.7 1995 1936 1997 1338 1399 2000 2001 2002 2003 2004 2005 2006 2007 2008 2009 (budget) Average France Teoperature Sales Yolene Volun. Groet (degrees Celsius) 1'000 litrea 1.344 1,435 6.7% 28.4 1,484 3.4% 30.9 1.714 15.5% 32.9 2,031 18.5% 27.3 1,384 -2.3% 30.0 2 208 11.34 30.5 2.489 12.73 30.8 2.761 10.94 2,998 8.6% 23.7 3.216 7.3% 30.3 3.445 7.1% 236 3.797 10.2% 4,087 7.6% 4.455 3.0% 23.8 C 9.12 30.0 Year 30.8 31.2 31.6 1995 1996 1997 1938 1939 2000 2001 2002 2003 2004 2005 2006 2007 2008 2009 (budget) Average Spain Temperature Sales Volume Volume Groot (degrees Celsius) ('000 litres) 1,069 1272 18.3% 29.0 1,402 10.2% 1.685 20.2% 23.8 1,052 9.9% 28.3 2,006 8.3% 26.0 1,364 2,033 3.54 23.9 9.82 2,481 11.2% 31.8 2.684 32.4 3.036 13.1% 30.4 3.346 310 3,722 113% 4,034 10.03 30.2 C 10.22 215 2.231 10 24 Year 30.4 Italy Temperature Sales Volume Volume Groot [degrees Celsius) roo0 litres 32.2 892 1,036 16.1% 28.6 1.143 10.3% 31.8 1,434 25.6% 1.508 5.12 28.2 1.639 8.7% 23.0 1,771 8.0% 26.3 1072 5.7% 30.1 2,090 30.0 2,433 2,725 12.0% 29.7 C 12.02 1999 2000 2001 2002 2003 2004 2005 2006 2007 2008 2003 (budget) Average 28.1 11.7% 16.43